

2013 Energy Commodity Prices Increased, Or Decreased Modestly, While Non-Energy Commodities Fell, Breaking Historic Pattern

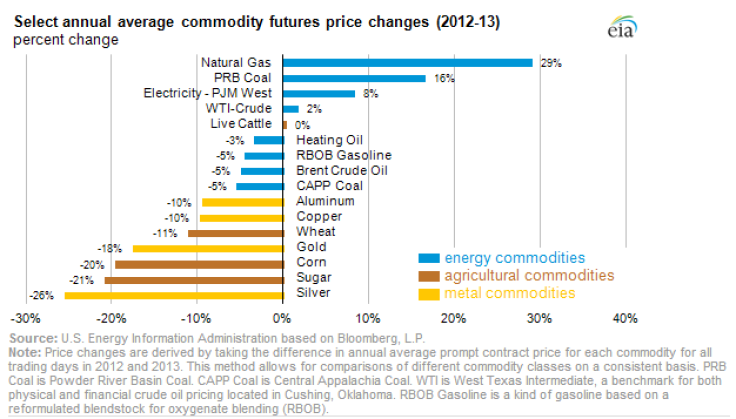
Prices of energy commodities decreased only modestly or increased last year, while prices of non-energy commodities like wheat and copper generally fell significantly, according to the U.S. Energy Information Administration (EIA).
Natural gas, western coal, electricity and West Texas Intermediate (WTI) crude prices increased, while North Sea Brent crude oil, petroleum products and eastern coal prices decreased slightly.
“In total, the divergence between price trends for energy and non-energy commodities grew after the summer of 2013,” the EIA report said. “This is in contrast to 2012 when metals prices were stable or experienced slight increases, and a severe drought drove prices of some agricultural commodities higher in the second half of the year.”
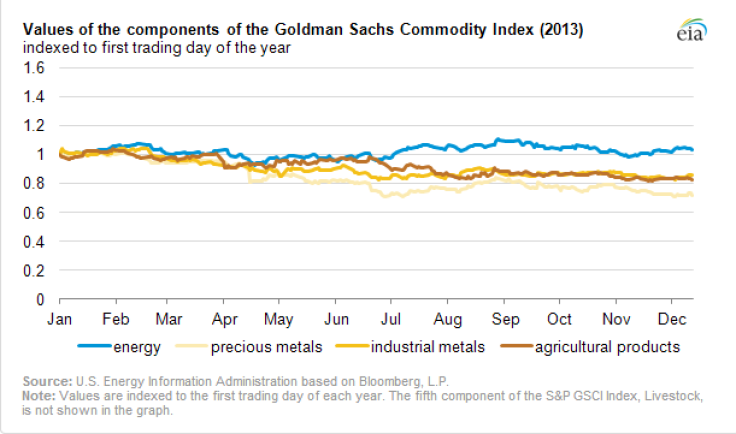
The energy component of the S&P Goldman Sachs Commodity Index ended in 2013 close to its year-earlier starting point, while the Grains, Industrial Metals and Precious Metals indexes ended 2013 down 17 percent, 20 percent and 27 percent, respectively, from their starting points.
WTI and Brent crude oil make up nearly 70 percent of the Energy index. Supply disruptions in Libya in July and uncertainty about the military conflict in Syria in August influenced the rise in crude prices. However, as the geopolitical issues subsided, crude prices declined.
Petroleum products and natural gas contribute to the remaining 30 percent of the Energy index. Heating oil prices rose from strong demand and low inventories, but gasoline prices declined. Suppliers produced an abundant supply of gasoline for heating oil and diesel fuel.
In recent years, the crude oil futures price changes have been positively correlated with the price changes of other commodities. The diverging price changes suggest that commodity sector prices are responding to factors in their individual markets rather than expectations of global economic growth. Shifts in expectations of global economic growth tend to increase or decrease the prices of all commodities.
Wheat, soybeans and corn make up the Grains index, with corn accounting for about 40 percent of it. Corn prices fell 40 percent year-end to year-end or 14 percent year-average to year-average, according to Fact Set data reported by the Wall Street Journal. Favorable weather conditions during harvest season produced better-than-expected crop yields, one of the highest recorded at 14 billion bushels.
Copper and aluminum make up 80 percent of the Industrial Metals index. Copper prices declined in 2013 due to concerns that economic growth in large commodity-consuming countries like China is slowing, resulting in reduced demand. Copper inventories also increased, peaking in the summer months and driving prices down. The price of gold also declined, dragging down the Precious Metals index, of which gold prices contribute 85 percent.
© Copyright IBTimes 2024. All rights reserved.
-

Ukraine, Israel, TikTok: The Massive Aid Package Before US Congress
-

Eiffel Tower Loses Sparkle For Parisians Ahead Of Olympics
-

Former Number One Momota Retires From International Badminton At 29
-

Why Insurance Prices Have Skyrocketed
-

World Bank Aiming To Connect 250 Mn Africans To Energy Grid By 2030
-

IMF Says Global Debt Levels Face 'Great Election Year' Risk
-

Divisions Among Colombia's FARC Dissidents Complicate Peace Talks
-

French Far Right Gets Youthful Vibe With 28-year-old Leader
-

US Fed's Powell Says Inflation Fight May Take 'Longer Than Expected'
-

Mideast-related Oil Price Spike Threatens 'Relatively Good' Economic Outlook: IMF Chief Economist


