

7 Reasons Why July’s US Jobs Report Is Not As Good As It Seems
ANALYSIS

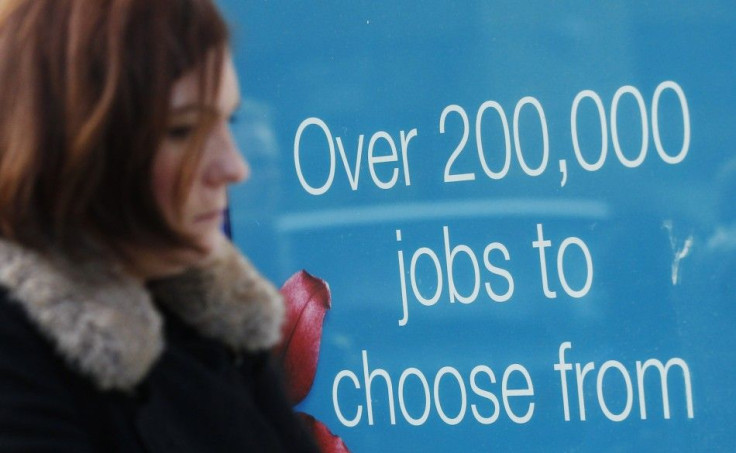
A first glance, Friday's better-than-expected U.S. jobs report might have offered a glimmer of hope after four straight months of dismal jobs numbers. But devil is in the details.
The Labor Department reported that hiring in July reached its best level since February, with 163,000 jobs added. The rise in nonfarm payrolls beat expectations of 100,000 extra jobs and compares with a rise of 80,000 in June. The unemployment rate rose to 8.3 percent in July, from 8.2 percent in the prior two months.
Beneath the seemingly positive headline, however, lay some worrying signs:
More discouraged workers. Months of lousy job gains didn't seem to have driven job-seekers to the sidelines as the labor force participation rate held steady at 63.8 percent in both May and June. But that level of confidence is starting to fade.
In the household survey, which produces the unemployment rate, both the employment-to-population ratio and the labor force participation rate dropped. And these are definitely not signs of a healthy labor market.
In July, the labor force participation rate fell to 63.7 percent, while the employment-to-population ratio slid to 58.4 percent, from 58.6 percent in the prior two months. If labor force participation rate hadn't declined since June, unemployment rate would have risen to 8.4 percent.
Further, according to the household survey, employment fell 195,000 in July, its first decline in three months. Moreover, the entire decline was in full-time jobs, which sagged 228,000 and has shrunk now in three of the past four months.
The so-called real unemployment rate rose to 15 percent in July. The government's most widely publicized unemployment rate measures only those who are out of a job and currently looking for work. It does not count discouraged potential employees who have quit looking, nor those who are underemployed -- people wanting to work full-time but who took a part-time schedule instead because that's all they could find.
The broader unemployment rate, known as the "U-6" for its data classification by the Labor Department, provides a more complete tally of how many people really are out of work.
Driven by a jump in both the number of part-time workers who would prefer a full-time job and the number of discouraged workers, the U-6 rate rose to 15 percent in July.
A good portion of the job growth in July came from workers getting part-time jobs. The number of Americans classified as "part time for economic reasons" - meaning they're working part-time because they can't find a full-time job - rose by 36,000 to 8.25 million.
Fewer people quit their jobs. The number of people unemployed because they quit their jobs fell by 58,000, which may be a sign workers are becoming less confident in their prospects. In June, 45,000 left their jobs voluntarily.
Temporary jobs and seasonal adjustments gave a good boost to the figures. Manufacturing payrolls increased 25,000 in July, but that is largely due to fewer layoffs in the auto sector than usual as manufacturers kept production lines running during the month. The motor vehicles and parts sector contributed 13,000 jobs.
While employment in professional and business services increased by 49,000 in July, 14,100 of those jobs created were in the temporary help services sector, which means businesses are uncertain about the economic outlook and are reluctant to hire full-time employees.
More time in school doesn't translate into lower unemployment rate. In July, 4.8 million of the 9 million people older than 25 looking for work had a bachelor's degree or higher. This means the majority of people who are unemployed have some college education, reversing the situation that prevailed for decades. In 1992, only 37 percent of the unemployed had some college experience.
Now, think about the massive student-loan-debt crisis. Americans owe more than $1 trillion in student loans, and according to a July report by the Consumer Financial Protection Bureau.
Government continues to shed jobs, causing job loss throughout the economy and creating an enormous drag on the recovery. In July, government payrolls dropped by 9,000, as local governments laid off teachers. The federal government cut 2,000 employees, the state government slashed 6,000 workers and the local government shed 1,000 employees.
While the job losses in the public sector were as bad as they were during the 2009 and 2019 period, it still has a significant impact on the private sector, since public-sector workers need to use inputs into their work that are sourced by the private sector. Police officers need cars, teachers need books and firefighters need trucks and hoses.
The Economic Policy Institute calculates that for every public-sector job lost, roughly 0.43 supplier jobs are lost. Moreover, the economic "multiplier" of state and local spending is also large -- around 1.24. That means, for every dollar cut in salary and supplies of public-sector workers, another $0.24 is lost in purchasing power throughout the rest of the economy.
May and June payrolls were revised down 6,000. Employment for May and June was revised to show 6,000 fewer jobs created than previously reported.
The direction of the revision is indicative of the trend in the jobs market and the U.S. economy. Net revisions were very negative during the financial crisis in the fourth quarter of 2008 but turned positive as the economy began to heal.
Wonder what August might have in store for us?
© Copyright IBTimes 2024. All rights reserved.
-

Eiffel Tower Loses Sparkle For Parisians Ahead Of Olympics
-

Former Number One Momota Retires From International Badminton At 29
-
World Bank Aiming To Connect 250 Mn Africans To Energy Grid By 2030
-

IMF Says Global Debt Levels Face 'Great Election Year' Risk
-

Divisions Among Colombia's FARC Dissidents Complicate Peace Talks
-

French Far Right Gets Youthful Vibe With 28-year-old Leader
-

US Fed's Powell Says Inflation Fight May Take 'Longer Than Expected'
-

Mideast-related Oil Price Spike Threatens 'Relatively Good' Economic Outlook: IMF Chief Economist
-

Wine Growers 'On Tip Of Africa' Race To Adapt To Climate Change
-

Despite Olympic Truce, Games Wrestle With Political Fallout


