

First Global Map of Ocean Salinity Unveiled by NASA's Aquarius
For the first time, a map of the salinity of the ocean surface has been produced by NASA's new Aquarius satellite, which began working only a month ago.
Aquarius is aboard the Aquarius/SAC-D (Satélite de Aplicaciones Científicas) observatory, a collaboration between NASA and Argentina's space agency, Comisión Nacional de Actividades Espaciales (CONAE).
Aquarius' salinity data are showing much higher quality than we expected to see this early in the mission, said principal investigator Gary Lagerloef of Earth and Space Research in Seattle. Aquarius soon will allow scientists to explore the connections between global rainfall, ocean currents and climate variations.
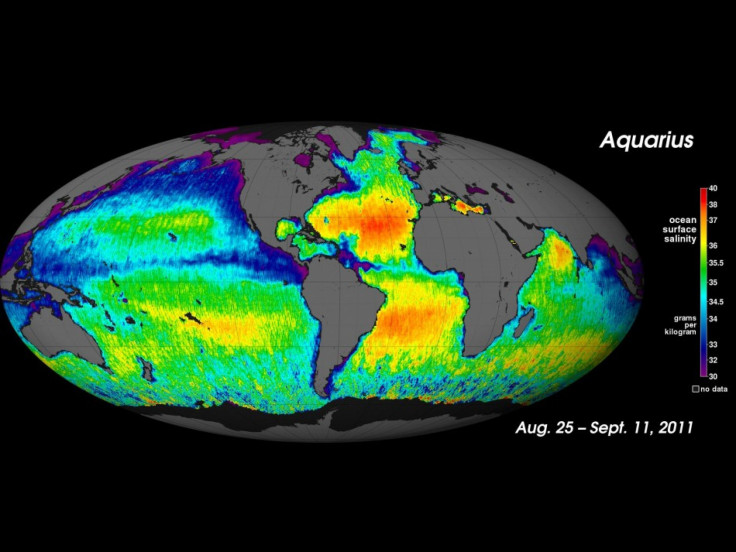
The new map, which shows a tapestry of salinity patterns, demonstrates Aquarius' ability to detect large-scale salinity distribution features clearly and with sharp contrast.
The map is a composite of the data since Aquarius became operational on Aug. 25. The mission was launched June 10 from Vandenberg Air Force Base in California.
Aquarius/SAC-D already is advancing our understanding of ocean surface salinity and Earth's water cycle, said Michael Freilich, director of NASA's Earth Science Division. Aquarius is making continuous, consistent, global measurements of ocean salinity, including measurements from places we have never sampled before.
To produce the map, Aquarius scientists compared the early data with ocean surface salinity reference data. Although the early data do contain some uncertainties and months of additional calibration and validation work remain, scientists are impressed by the data's quality.
Aquarius has exposed a pattern of ocean surface salinity that is rich in variability across a wide range of scales, said Aquarius science team member Arnold Gordon, professor of oceanography at Columbia University and its Lamont-Doherty Earth Observatory in Palisades, N.Y. This is a great moment in the history of oceanography. The first image raises many questions that oceanographers will be challenged to explain.
The map shows several well-known ocean salinity features such as higher salinity in the subtropics; higher average salinity in the Atlantic Ocean compared to the Pacific and Indian oceans and lower salinity in rainy belts near the equator, in the northernmost Pacific Ocean and elsewhere.
These features are related to large-scale patterns of rainfall and evaporation over the ocean, river outflow and ocean circulation. Aquarius will monitor how these features change and study their link to climate and weather variations.
© Copyright IBTimes 2024. All rights reserved.
-

IMF Says Global Debt Levels Face 'Great Election Year' Risk
-

Divisions Among Colombia's FARC Dissidents Complicate Peace Talks
-

French Far Right Gets Youthful Vibe With 28-year-old Leader
-

US Fed's Powell Says Inflation Fight May Take 'Longer Than Expected'
-

Mideast-related Oil Price Spike Threatens 'Relatively Good' Economic Outlook: IMF Chief Economist
-

Wine Growers 'On Tip Of Africa' Race To Adapt To Climate Change
-

Despite Olympic Truce, Games Wrestle With Political Fallout
-

What Will The Fed Do With The Latest Inflation Numbers?
-

US Retail Sales Up More Than Expected In March
-

Alexandre De Moraes: Brazil Judge In Feud With Elon Musk


