

Forex-GBP/USD-First support seen around 1.6; key US data awaited
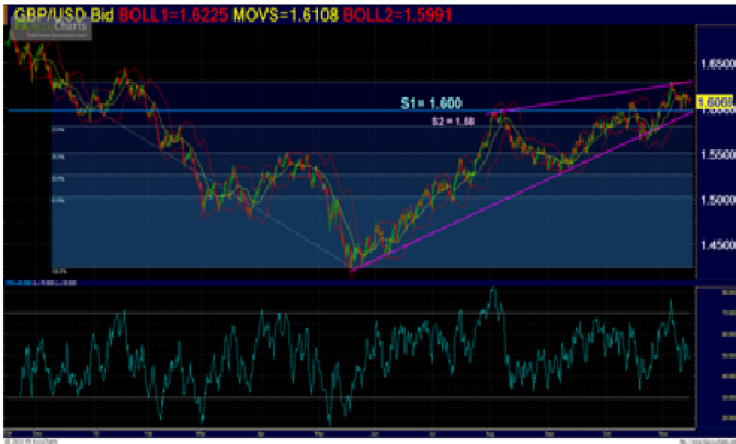
The GBP/USD 4-hour chart pattern suggests further weakness in the pair with the immediate support seen around 1.600, where the Bollinger lower band meets trend-line connecting bottoms from mid-May lows near 1.42. Second support is seen near 1.58, the 23.6 percent Fibonacci retracement from mid-May levels.
The sterling could fundamentally also weaken due to a weak house price data and amid broad strengthening of the US dollar.
The UK housing market saw November sellers cut their asking prices by 3.percent, Rightmove reported on Monday. The biggest monthly drop since December 2007 followed a mysterious rise in asking prices of 3.1 percent in October.
One British pound was worth 1.6066 US dollars around 12:30 GMT. Data awaited from the US on Monday are October retail sales which analysts see rising by 0.8 percent on month, up from previous month's 0.6 percent.
September business inventories and November empire state survey are also expected to impact the currency market but not as important as the retail sales. Key speakers on the day include Richmond Fed president Lacker and top Treasury official Brainard.
© Copyright IBTimes 2024. All rights reserved.
-

Eiffel Tower Loses Sparkle For Parisians Ahead Of Olympics
-

Former Number One Momota Retires From International Badminton At 29
-

World Bank Aiming To Connect 250 Mn Africans To Energy Grid By 2030
-

IMF Says Global Debt Levels Face 'Great Election Year' Risk
-

Divisions Among Colombia's FARC Dissidents Complicate Peace Talks
-

French Far Right Gets Youthful Vibe With 28-year-old Leader
-

US Fed's Powell Says Inflation Fight May Take 'Longer Than Expected'
-

Mideast-related Oil Price Spike Threatens 'Relatively Good' Economic Outlook: IMF Chief Economist
-

Wine Growers 'On Tip Of Africa' Race To Adapt To Climate Change
-

Despite Olympic Truce, Games Wrestle With Political Fallout


