

[GRAPHIC] CBO Reports Suggests Growth In US Income Inequality Will Continue Through 2035 (But, Hey, As Long As Capital Markets Are Doing Great, Right?)

The U.S. entered the 21st century with more than 60 percent of the nation’s income going to the top 1 percent of earners – approaching levels of income disparity unseen since the 1920s runup to the Great Depression. And the situation hasn't improved since, as a new Congressional Budget Office report confirms.
The report, which can be read here, is filled with technical details about methodologies that only a labor economist would adore, but the conclusion should be enough to make working Americans cringe: income inequality, which has been growing steadily for the past 40 years, will continue for the next two decades.
Take for example what the report says about men’s income:
At the median, full-time-equivalent earning, or what a person can earn if fully employed throughout the year, incomes for men have fallen over the past few decades and are projected to continue to fall. Between 1984 and 2009, earnings at the middle of the men’s distribution declined slightly from about $23,000 to $22,000. That decline is projected to continue over the following 25 years and to reach about $18,000 by 2035. In contrast, earnings at the top of the men’s distribution increased.
The situation is even worse for women who still earn less than their male counterparts.
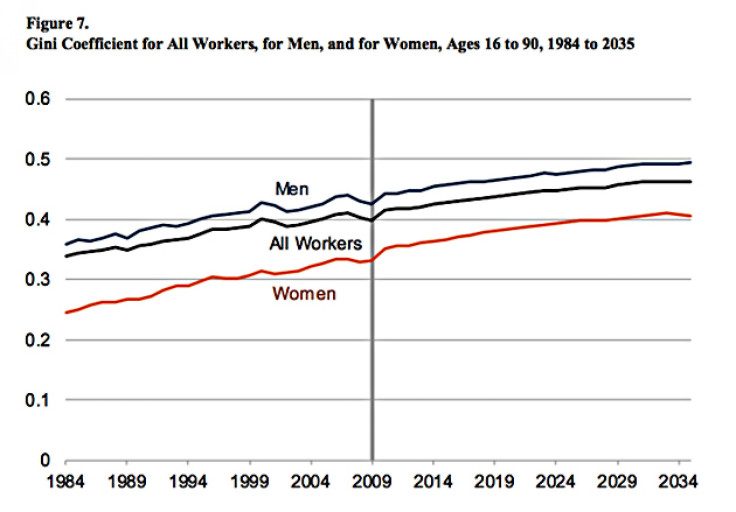
The above chart shows the Gini coefficient – a wonky measure of inequality that ranks earnings against no income inequality, which shows an upward trend of income inequality though 2034. Interestingly, while most women will be earning less in 2034 than they currently earn, they will see a slight improvement as the lowest-paid female workers begin to make more than their lowest-paid male counterparts starting around 2030, according to the study.
So what’s the problem? The answer to that question is complicated and has many different takes.
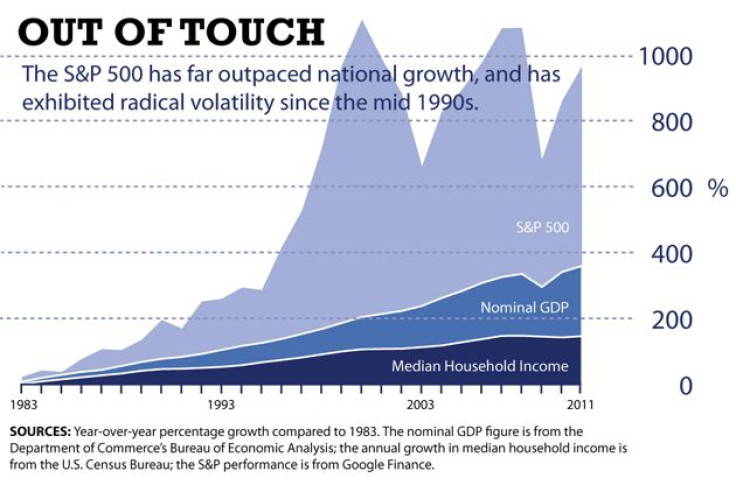
What we do know is that median household income has been stagnant and the private sector hasn’t stepped up sufficient jobs creation to meet demand. Meanwhile, capital markets years ago shook off the effects of the last global economic downturn while multinational corporations scour the planet for the cheapest possible labor and divest from costly first world labor markets — along the way ensuring Wall Street is satisfied with their performance, and investors are showered with quarterly dividends.
Here’s a chart comparing the year-over year growth in the S&P 500-stock index compared to median household income and GDP growth.
According to data compiled by economists Emmanuel Saez, of the University of California, Berkeley and Thomas Piketty, of the Paris School of Economics, the level of income disparity in the U.S. is nearly where it was before the Great Depression, when 70 percent of the nation’s income was captured by 1 percent of the population. (Read more about Saez and Piketty in this 2012 New York Times article.)
By the 1960s, about 70 percent of national income was held by 90 percent of income earners, but the "Great Divergence" in the U.S. economy that began in the 1970s has sent the pendulum back in the other direction. By 2007, about 65 percent of the national income returned to the top 1 percent of income earners, according to the undisputed peer-reviewed data by Saez and Piketty.
© Copyright IBTimes 2024. All rights reserved.
-

IMF Says Global Debt Levels Face 'Great Election Year' Risk
-

Divisions Among Colombia's FARC Dissidents Complicate Peace Talks
-

French Far Right Gets Youthful Vibe With 28-year-old Leader
-

US Fed's Powell Says Inflation Fight May Take 'Longer Than Expected'
-

Mideast-related Oil Price Spike Threatens 'Relatively Good' Economic Outlook: IMF Chief Economist
-

Wine Growers 'On Tip Of Africa' Race To Adapt To Climate Change
-

Despite Olympic Truce, Games Wrestle With Political Fallout
-

What Will The Fed Do With The Latest Inflation Numbers?
-

US Retail Sales Up More Than Expected In March
-

Alexandre De Moraes: Brazil Judge In Feud With Elon Musk


