

Iconic Climate Graph Keeling Curve On Atmospheric Carbon Dioxide Named National Landmark

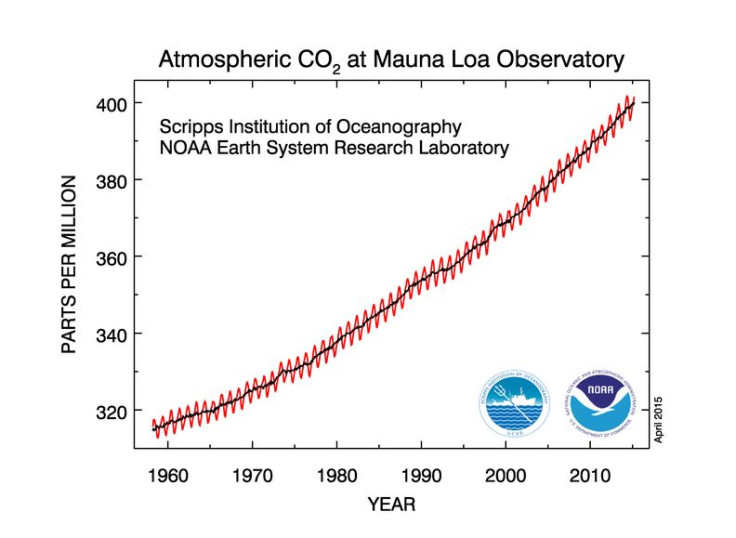
In March, the atmospheric concentration of carbon dioxide crossed an ominous milestone of 400 parts per million (ppm) -- 57 years after geochemist Charles David Keeling of Scripps Institution of Oceanography, University of California, San Diego, first began taking measurements of the gas. The Keeling Curve -- depicting the inexorable rise in the levels of atmospheric carbon dioxide -- has since become one of the most recognizable indicators of humans’ impact on Earth’s climate.
Now, the American Chemical Society (ACS) has named the graph, which is the world’s longest unbroken record of atmospheric carbon dioxide concentrations, a National Historic Chemical Landmark for “providing an authoritative record of atmospheric carbon dioxide concentrations that is a cornerstone of modern climate science.” Friday's ceremony at San Diego campus of the Scripps Institution of Oceanography, which officially marked the landmark status to the iconic graph, comes after last month's announcement.
“The Keeling Curve is an icon of modern climate science," Thomas J. Barton, the most recent past president of the ACS, said in a statement in May. “Keeling recognized in 1960 that fossil fuels are driving global atmospheric change, which presents serious challenges for Earth and its people. The global impacts of climate change are what make Keeling’s work so important, and so celebrated, today.”
In 1958, when Keeling first began taking the measurements from the Mauna Loa Observatory in Hawaii operated by the National Oceanic and Atmospheric Administration (NOAA), the atmospheric carbon dioxide levels stood at 317 ppm. According to the most recent readings, taken on June 11, this number currently stands at over 402 ppm -- concentrations that are unprecedented in millions of years.
The small annual zigzag visible on the curve shows the slight variations associated with the seasons. Carbon dioxide levels drop during the northern hemisphere spring and summer, when plants consume more carbon dioxide to grow. In the fall and winter, plants and leaves die off and decay, releasing the gas back into the atmosphere and causing a small rise. Measurements taken at several other sites have also confirmed the trend depicted by the graph.
“The Mauna Loa carbon dioxide record changed how we view the world. It proved for the first time that humans were altering the composition of air globally, and it thereby legitimized the concern over human-caused climate change,” Ralph Keeling, program director of the Scripps CO2 Program, who has continued his father’s work, said in the statement.
© Copyright IBTimes 2024. All rights reserved.
-

IMF Says Global Debt Levels Face 'Great Election Year' Risk
-

Divisions Among Colombia's FARC Dissidents Complicate Peace Talks
-

French Far Right Gets Youthful Vibe With 28-year-old Leader
-

Mideast-related Oil Price Spike Threatens 'Relatively Good' Economic Outlook: IMF Chief Economist
-

Wine Growers 'On Tip Of Africa' Race To Adapt To Climate Change
-

Despite Olympic Truce, Games Wrestle With Political Fallout
-

What Will The Fed Do With The Latest Inflation Numbers?
-
US Retail Sales Up More Than Expected In March
-

Alexandre De Moraes: Brazil Judge In Feud With Elon Musk
-

Paris 2024 Games Flame To Be Lit In Ancient Olympia


