

Infographic: How Economies Reacted To COVID-19 Varies Substantially
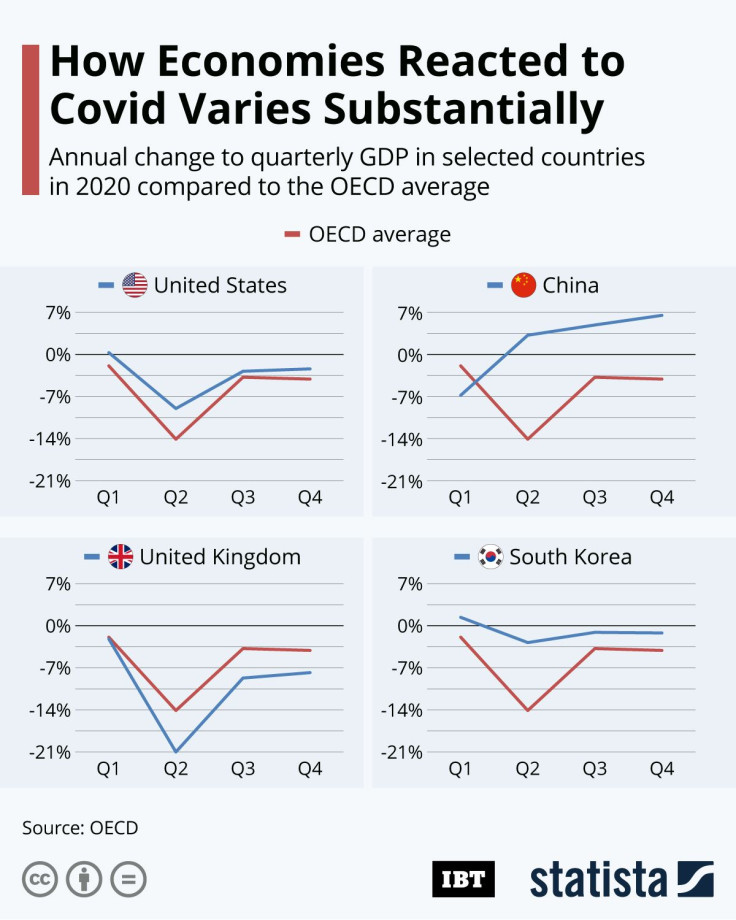
With the whole world still battling the Covid-19 pandemic, each country has its own unique story to tell. While differing government responses and strategies had direct and sometimes devastating effects on the human toll of the crisis, the manner in which national economies reacted in 2020 has also varied vastly, as this infographic using OECD data shows.
China, the first country to feel the effects of the virus saw its largest YOY fall in quarterly GDP in Q1, when output decreased by almost seven percent. Since then though, the Asian economic powerhouse has been one of few countries to actually be posting positive figures in the last three quarters of 2020.
South Korea is another example of how containing the outbreak sufficiently at the beginning of the pandemic has paid dividends when it comes to the economy. Case numbers have risen significantly in 2021, but Korea provided a blueprint in 2020 for how to best deal with the coronavirus. This is reflected in its economic output which, despite paling in comparison to the rally performed by China, remained steady and always ahead of the global average.
The United States and the United Kingdom however struggled throughout 2020, not only in terms of cases and deaths but, in the case of the UK especially, also economically. The Johnson government oversaw one of the biggest falls in GDP of all developed economies in Q2 and saw the year out consistently and firmly below the OECD average growth rate. Although the United States performed above average throughout 2020, a comparison with arch economic rival China puts things into perspective.
-

IMF Says Global Debt Levels Face 'Great Election Year' Risk
-

Divisions Among Colombia's FARC Dissidents Complicate Peace Talks
-

French Far Right Gets Youthful Vibe With 28-year-old Leader
-

US Fed's Powell Says Inflation Fight May Take 'Longer Than Expected'
-

Mideast-related Oil Price Spike Threatens 'Relatively Good' Economic Outlook: IMF Chief Economist
-

Wine Growers 'On Tip Of Africa' Race To Adapt To Climate Change
-

Despite Olympic Truce, Games Wrestle With Political Fallout
-

What Will The Fed Do With The Latest Inflation Numbers?
-

US Retail Sales Up More Than Expected In March
-

Alexandre De Moraes: Brazil Judge In Feud With Elon Musk


