

Is it time to be cautious on silver? Technicals say yes
For the last few months, a world that is fearful about fiat currencies losing value due to reasons ranging from demand-led inflation in China to the Fed printing more dollars in the US has been increasingly embracing gold as its dearest choice of investment.
Yes, commodities as a whole, among them precious metals in particular, were all at the gainer's end due to this, but silver outpacing the yellow metal was interesting for many.
However, a study on charts shows that silver may not continue to enjoy the status of being better investment alternative over gold in the short-to-medium-term period. And not just that, any correction in both the metals (which looks imminent as per charts and market experts) will happen with the white metal falling much steeper than its yellow counterpart.
Performance in the recent past
So far in 2010, when gold rallied by around 30 percent to its all time high of $1424.1 an ounce on Tuesday silver was up by more than 74 percent at its 30-year high of $29.33 per ounce. Commodities were largely down in the third week of October but after gaining ground on October 22, silver rose by around 28.6 percent to its peak while gold was up by only 8.3 percent.
The fact that silver is not only a precious metal but is one with industrial utility as well probably gave extra boost to the metal but the trend has now reached a level where a reversal is imminent, at least for technical reasons.
History of gold/silver ratio
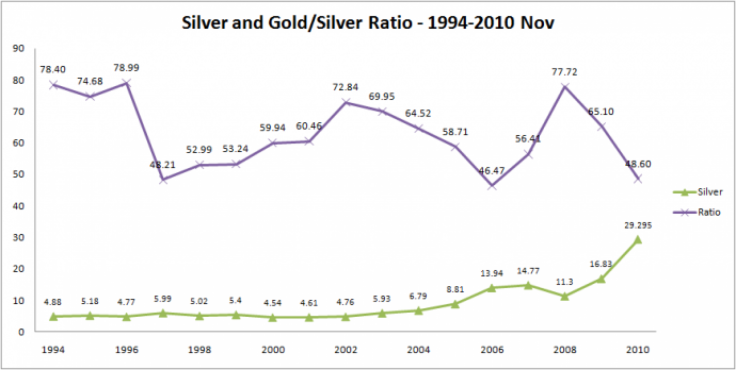
The ratio of price of gold to that of silver used to be roughly in a range of 46-78 from 1994 and what is interesting is that the ratio never had a long life around 46-50 region - it always jumped from there soon, or in other words, gold picked up pace and eventually did outshine silver.
Chart number 1 attached (plotted on year-end prices of both the metals based on Reuters data) shows the correlation of silver prices gold/silver ratio.
It is evident from the chart that the peak on the wave formed by silver during 2005-2008 period correlated to a gold/silver ratio of around 46 and then the yellow metal rallied more sharply than silver, taking the ratio to near 78 levels by end-2008. Go backward in chart and we can see a similar price movement in 1997.
Now we have the ratio once again in the 50-region and it looks like a fair advice by chart busters to be cautious on going further long on silver.
Other factors in support of the yellow metal
The dollar is expected to remain under pressure with most market participants seeing the Fed's quantitative easing to be expanded while many majors in the Asia-Pacific are visibly in a tightening mode. This is obviously a gold positive but of course, it could also have silver as an implied beneficiary. At the same time, as silver prices are a lot dependant on industrial demand, any news of cooling in major economic powerhouses like China will hit the white metal more severely, but its golden brother may still be considered a safe haven.
Even if the greenback gets on track due to reasons like short-covering - a Morgan Stanley report says that net dollar short positions were near record levels a few weeks ago - a subsequent fall in the precious metals will all likely see silver losing more in percentage terms compared to gold. On Tuesday, when the dollar gained in the forex market, the yellow metal fell nearly 1.2 percent while silver dropped by 2.9 percent.
The gold silver ratio that fell to its lowest since 2006 at 48.60 as per Tuesday's highs has moved up to 51.55 levels by Wednesday's close.
Projections see steeper falls in silver
With the momentum indicator 14-day RSI on daily chart shows gold has just crossed the 70 mark, but still in the overbought territory, first level of support can be near $1372.7, or the 23.6 percent Fibonacci retracement from late August levels. Next support is seen at around the 38.2 percent Fibonacci of $1340.8. See chart number 3.
At the same time, despite a 2.9 percent fall on Tuesday, silver's 14-day RSI has not yet fallen below the 70 mark on the daily chart. The immediate support is seen around the 23.6 percent Fibonacci from late August levels, pointing to $26.63 levels. Further on, the white metal targets $24.9 on the downside, as shown by the 38.2 percent Fibonacci retracement. See chart number 4.
At first level of support, gold will be 3.6 percent down from its Tuesday's high whereas silver will be 9.2 percent down. At support number two, the yellow metal will be 5.8 percent down and silver will be weaker by 15.1 percent from the recent highs, which clearly shows the fall in silver can be as steep as its rise was in the recent weeks and months over gold's.
Chart number 4 shows that silver is now at a point where a convergence is highly likely as it happened towards end of last year.
© Copyright IBTimes 2024. All rights reserved.
-

Eiffel Tower Loses Sparkle For Parisians Ahead Of Olympics
-

Former Number One Momota Retires From International Badminton At 29
-

World Bank Aiming To Connect 250 Mn Africans To Energy Grid By 2030
-

IMF Says Global Debt Levels Face 'Great Election Year' Risk
-

Divisions Among Colombia's FARC Dissidents Complicate Peace Talks
-

French Far Right Gets Youthful Vibe With 28-year-old Leader
-

US Fed's Powell Says Inflation Fight May Take 'Longer Than Expected'
-

Mideast-related Oil Price Spike Threatens 'Relatively Good' Economic Outlook: IMF Chief Economist
-

Wine Growers 'On Tip Of Africa' Race To Adapt To Climate Change
-

Despite Olympic Truce, Games Wrestle With Political Fallout


