

January 2013 US Home Prices: Zillow Says They're Up For 15th Month Straight, A Rate Of Growth Unseen Since The Run-Up To 2006 Housing Bubble

Economic uncertainties aside, Americans have been pushing up home prices for the past 15 months at a rate not seen since the 2006 run-up to the peak of the housing bubble.
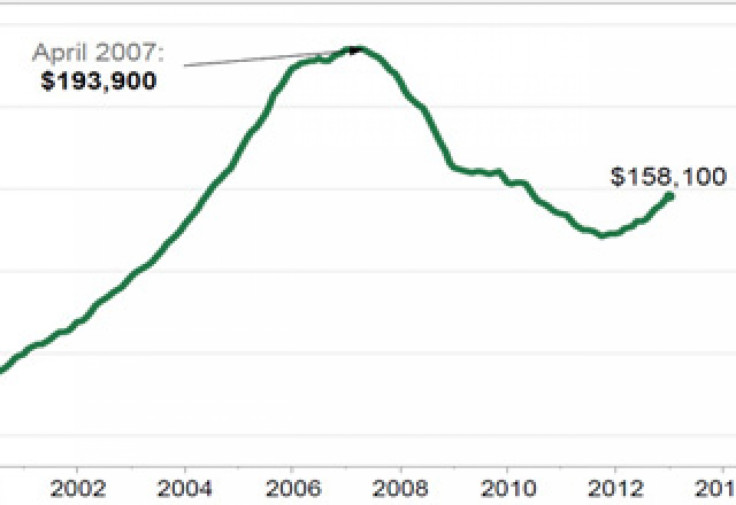
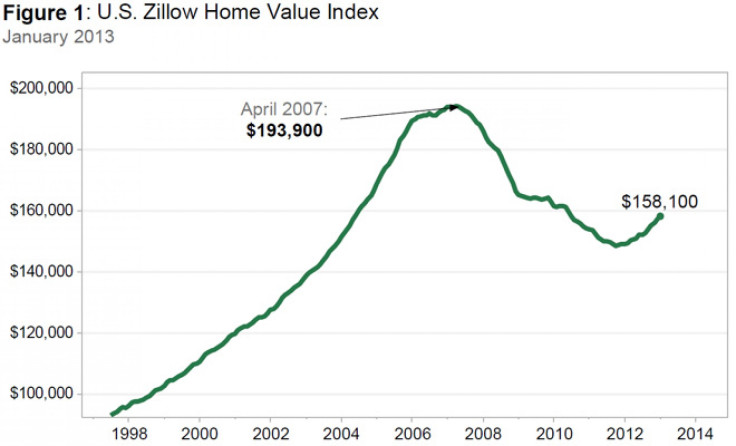
According to online real estate database Zillow Inc.’s (NASDAQ:Z) monthly real estate market report, national home prices surged 6.2 percent in January compared with the same month last year. It was the highest rate of growth since July 2006 when the rate hit 7.5 percent. The Seattle-based company said rents are up, too, by 4.2 percent nationwide.
Home prices are a closely watched metric because demand for housing is a key indicator of consumers’ confidence in taking out mortgages. Rising home prices also mean construction of new units will increase as demand pushes prices up. New homeowners also tend to make ancillary purchases, such as for new appliances.
“Most markets have already hit a bottom -- with only nine out of 260 not projected to hit a bottom within the next year,” said the report, which assesses 260 markets nationwide.
Zillow predicts that 78 of these markets will see home values appreciate by at least 3 percent in 2013.
© Copyright IBTimes 2024. All rights reserved.
-

Taiwan Hit By Dozens Of Strong Aftershocks From Deadly Quake
-

Gaza Health System 'Completely Obliterated': UN Expert
-

In Ecuadoran Amazon, Butterflies Provide A Gauge Of Climate Change
-

50 Years On, Vintage Vehicles To Reenact Portugal's Carnation Revolution
-

Conflicts Push Military Spending To 'All-time High': Report
-

'Thank You, America:' Zelensky And Netanyahu Applaud House Passage Of Foreign Aid Package
-

Women Journalists Bear The Brunt Of Cyberbullying
-

US Aid Shows Ukraine Will Not Be 'Second Afghanistan': Zelensky
-

Elon Musk's X Fights Australian Watchdog Over Church Stabbing Posts
-

Ukraine, Israel, TikTok: The Massive Aid Package Before US Congress


