

Jobless Claims Numbers Indicate Positive Trend for Jobseekers Despite More Job Cuts

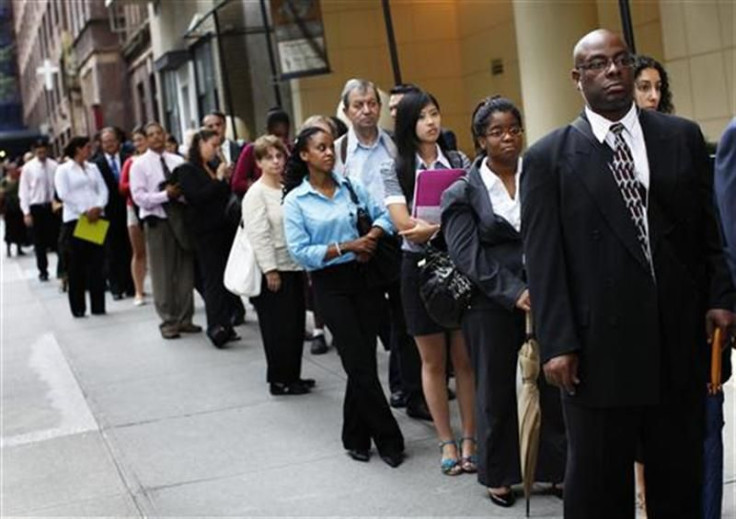
Latest data on new claims for unemployment sent mixed signals to the market, showing that while the week ended Nov. 19 was the third straight week for initial claims to hold below 400,000, a mark that most economists believe is essential for the economy to add more jobs than it is shedding, application for jobless insurance increased by 2,000 to 393,000.
That figure is below the 390,000 estimate from economists polled by Reuters. The prior week's figure was revised up to 391,000 from the previously reported 388,000.
The four-week moving average, which is considered a less-volatile measure than the weekly figures, dropped to 394,250, the lowest level since April, from 397,500. Since this number tends to smooth out any anomaly events such as holiday seasonal hiring, strike, severe weather condition, etc, it could mean that the economy is gaining traction, though only gradually.
Here's a look at some of the job cuts that made headlines in the past week.
Private Sector Job Cuts
Bank of America (NYSE: BAC) had begun layoffs, as part of a plan previously announced by CEO Brian Moynihan to eliminate 30,000 jobs at the bank "over the next few years."
Citigroup (NYSE: C) may cut as many as 3,000 jobs as Chief Executive Officer Vikram Pandit squeezes out costs.
BNP Paribas, France's biggest bank, said today it will trim about 1,400 jobs at its investment banking unit, with most coming from the lender's capital markets and structured-finance teams.
UBS (NYSE: UBS) said it would cut 2,000 investment bank jobs by 2016, a move that came after the bank said in August that it would cut 3,500 jobs -- some 5 percent of its workforce.
Public Sector Job Cuts
The Internal Revenue Service has also offered buyouts to 5,400 employees as it begins preparing for a likely budget cut of more than 3 percent. A second round of buyouts could follow. The Obama administration has said that as many as 4,000 IRS jobs could be cut over the next year.
Massive Layoffs Declined in October
Some good news, however, did emerge from other data.
The Labor Department's Bureau of Labor Statistics tracks "mass layoffs," defined as layoffs of 50 or more workers from a single employer for a duration of 31 days or more.
The October results released Tuesday showed the number of mass layoff events decreased by 142 from September, and the number of associated initial claims decreased by 34,540. Employers took 1,353 mass layoff actions in October involving 118,689 workers.
September saw more people filing for unemployment benefits, compared with the October number, historical data from the Labor Department showed. Unemployment rate was 9.0 percent in October, essentially unchanged from the prior month but down from 9.7 percent a year earlier.
In October, total nonfarm payroll employment increased by 80,000 over the month and by 1,501,000 over the year.
Sixteen of the 19 major industry sectors in the private economy reported over-the-year decreases in average weekly initial claims, with the largest decreases occurring in construction and manufacturing.
The manufacturing sector accounted for 24 percent of all mass layoff events and 29 percent of initial claims filed in October. A year earlier, manufacturing made up 21 percent of events and 27 percent of initial claims. Within this sector, the numbers of mass layoff claimants in October was greatest in the food, machinery, and transportation equipment subsectors.
Geographically, all four regions experienced over-the-year decreases in average weekly initial claims, with the largest decline occurring in the West.
The Historical Trends
A look at the historical initial claims report can help us put today's release into context.
The earliest year of record available is 1967, when the seasonally adjusted initial claims registered at 208,000. It remained below 300,000 until August of 1970, the year when we only had $380.9 billion in Federal debt compared with the $15 trillion mark we hit last week.
Since the mid-1970s, it has been hard for weekly new jobless claims to fall below 400,000, and even more rarely to fall below 370,000.
During the 1990s, a period of booming technological innovation, business formation, corporate earnings growth and massive job creation, jobless claims basically remained below 350,000 for five years, from spring of 1996 to winter of 2001. During this period, the U.S. unemployment rate fell from 5.6 percent to 3.9 percent.
Following the burst of the Dot-com bubble, jobless claims hovered around the 400,000-level in mid-2001, then remained near that level until the fall of 2003.
During the 2002-2007 expansion when everyone believed real estate value could only go up, jobless claims fell below 400,000 from early in the fall of 2003, and then remained below 370,000 for about four and a half years, until March 2008.
Moving into the recent financial crisis, jobless claims began rising in December 2007 and reached above 480,000 in mid-September 2008, when Lehman Brothers filed for bankruptcy protection, the largest bankruptcy filing in U.S. history with over $600 billion in assets.
As the financial crisis magnified, jobless claims soared above the the 600,000 level in February of 2009.
Since those frightful months, jobless claims have fallen from a high of 659,000 to the latest 393,000, suggesting that while we aren't quite out of the woods yet, there is hope on the horizon.
© Copyright IBTimes 2024. All rights reserved.
-

Taiwan Hit By Dozens Of Strong Aftershocks From Deadly Quake
-

Gaza Health System 'Completely Obliterated': UN Expert
-

In Ecuadoran Amazon, Butterflies Provide A Gauge Of Climate Change
-

50 Years On, Vintage Vehicles To Reenact Portugal's Carnation Revolution
-

Conflicts Push Military Spending To 'All-time High': Report
-

'Thank You, America:' Zelensky And Netanyahu Applaud House Passage Of Foreign Aid Package
-

Women Journalists Bear The Brunt Of Cyberbullying
-

US Aid Shows Ukraine Will Not Be 'Second Afghanistan': Zelensky
-

Elon Musk's X Fights Australian Watchdog Over Church Stabbing Posts
-
Ukraine, Israel, TikTok: The Massive Aid Package Before US Congress


