

NASA Creates First Complete Map of Antarctic Ice Flow [VIDEO]

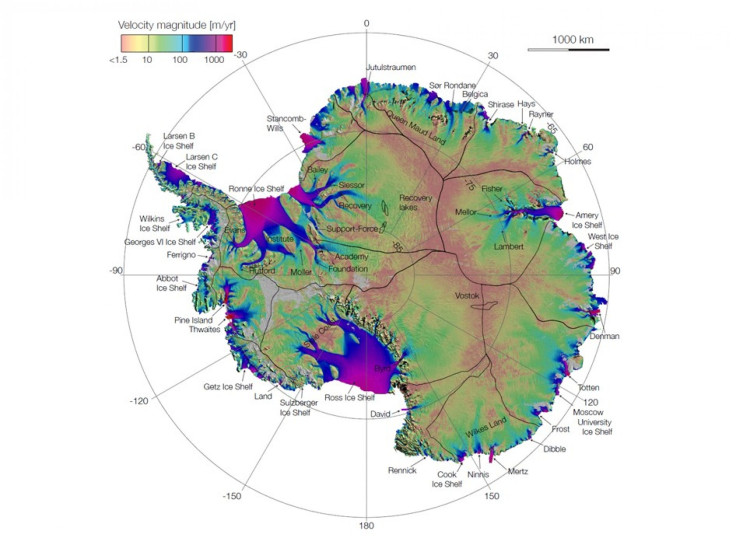
NASA-funded researchers created the first complete map of the speed and direction of ice flow in Antarctica, showing glaciers flowing thousands of miles from the continent's deep interior to its coast.
This map, NASA said, will be critical for tracking future sea-level increases from climate change. The team created it by using integrated radar observations from a consortium of international satellites.
This is like seeing a map of all the oceans' currents for the first time. It's a game changer for glaciology, said Eric Rignot of NASA's Jet Propulsion Laboratory in Pasadena, Calif.,in a statement.
Rignot, who is also from University of California (UC), Irvine, is lead author of a paper on the ice flow published online Thursday in Science Express.
We are seeing amazing flows from the heart of the continent that had never been described before, he added.
NASA said Rignot and UC Irvine scientists Jeremie Mouginot and Bernd Scheuchl used billions of data points captured by European, Japanese and Canadian satellites to weed out cloud cover, solar glare and land features masking the glaciers.
With the help of NASA technology, the team took the time to pieced together the shape and velocity of glacial formations, including the previously uncharted East Antarctica, which makes up 77 percent of the continent.
The scientists were surprised when they step back and glanced at the full picture, as they discovered a new ridge splitting the 5.4 million-square-mile (14 million-square-kilometer) landmass from east to west.
The team also found unnamed formations moving up to 800 feet (244 meters) annually across immense plains sloping toward the Antarctic Ocean and in a different manner than past models of ice migration, NASA said.
The map points out something fundamentally new: that ice moves by slipping along the ground it rests on, said Thomas Wagner, NASA's cryospheric program scientist in Washington, in a statement. That's critical knowledge for predicting future sea level rise. It means that if we lose ice at the coasts from the warming ocean, we open the tap to massive amounts of ice in the interior.
To our knowledge, this is the first time that a tightly knit collaboration of civilian space agencies has worked together to create such a huge dataset of this type, said Yves Crevier of Canadian Space Agency, also in a statement. It is a dataset of lasting scientific value in assessing the extent and rate of change in polar regions.
The work was done in conjunction with the International Polar Year, or IPY (2007 to 2008). The collaborators that worked under the IPY Space Task Group included NASA; the European Space Agency (ESA); Canadian Space Agency (CSA); Japan Aerospace Exploration Agency; the Alaska Satellite Facility in Fairbanks; and MacDonald, Dettwiler and Associates of Richmond, British Columbia, Canada.
Watch a video below.
© Copyright IBTimes 2024. All rights reserved.
-

French Air Traffic Controller Strike Threatens Flight Chaos
-

Azerbaijan Says 'Closer Than Ever' To Armenia Peace Deal Amid Border Talks
-

How UK's Biggest Water Supplier Sank Into Crisis
-

Taiwan Hit By Dozens Of Strong Aftershocks From Deadly Quake
-

Gaza Health System 'Completely Obliterated': UN Expert
-

In Ecuadoran Amazon, Butterflies Provide A Gauge Of Climate Change
-

50 Years On, Vintage Vehicles To Reenact Portugal's Carnation Revolution
-

Conflicts Push Military Spending To 'All-time High': Report
-

'Thank You, America:' Zelensky And Netanyahu Applaud House Passage Of Foreign Aid Package
-

Women Journalists Bear The Brunt Of Cyberbullying


