

Why Did Gold Crash In April 2013? Computerized Trading Is One Explanation


Gold’s 13 percent crash in April 2013, representing a sudden and steep decline of $200 per ounce over two momentous days, set the floor for gold’s poor performance in 2013, which saw its worst showing since 1981.
The cause of the abrupt decline, dubbed a “flash crash” by some, has been much debated. Analysts have cited weak buying of gold over China’s Lunar New Year, unsettling talk of Cyprus central bank gold sales, and highly visible mass sales from exchange-traded funds (ETFs). Others blame a bearish Goldman Sachs Group Inc. (NYSE:GS) call on gold in April.
Some gold bugs have even accused banks of manipulating the plunge artificially for profit, though they’ve offered little credible evidence.
But CPM Group commodities analyst Jeffrey Christian offered a simple explanation at a recent gold gathering in New York.
“If you go back to April 12, when the gold price started to fall sharply, it was more than 1,000 entities trading in a 10-minute period,” said Christian. “What you’re seeing is the effects of high-volume computerized trading.”
As prices break key thresholds, computer programs have orders to automatically buy or sell at certain levels. Multiply that by hundreds or thousands of trading entities, and millions of ounces of gold can shift hands in 10 minutes, said Christian.
“If you take off your gold-tinted glasses and look at the commodities market, you’ll see the same trading patterns have emerged across commodities,” he continued. “What you’re looking at is the product of our computerized trading system.”
Algorithmic traders sharing common sell or buy points are increasingly common across all assets, including stocks and bonds, he added. The computerized systems share similar trading strategies, though the commonality is a coincidence and a shared market mindset, rather than collusion.
A movement of $50 per ounce in one day is considered significant by investors who follow gold.
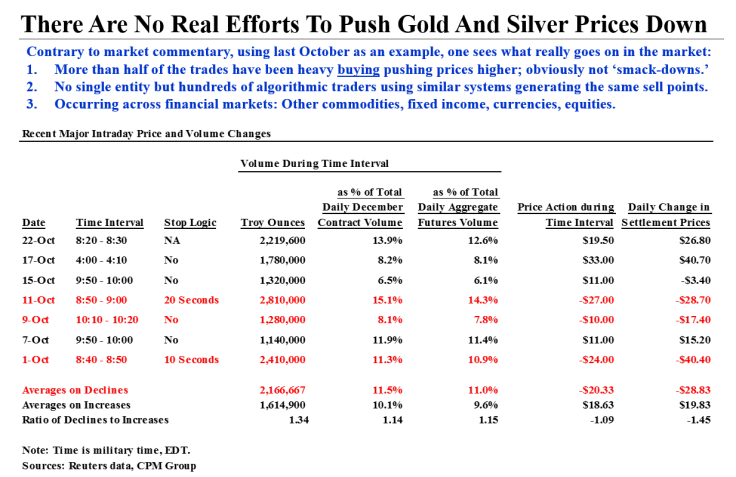
A CPM Group analysis of several days in October 2013, where gold traded at “outsized volumes” on New York’s COMEX futures exchange, found that prices both rose and fell, depending on the day. That deflates accusations that banks try to artificially suppress gold prices with the sheer weight of their trades.
“If you had access to the data … you would see that over these seven events, in 10- minute periods of time, those 1.3, 2.4, 2.8 million ounces, were bought or sold by more than 100 distinct trading entities in each instance,” said Christian.
When 2.4 million ounces of gold changed hands over a day on Oct. 1, prices fell $24 in 10 minutes. Conversely, on Oct. 22, prices rose by $26 by the end of the day, after a 10-minute window where 12 percent of that day’s trade took place.
© Copyright IBTimes 2024. All rights reserved.
-

Eiffel Tower Loses Sparkle For Parisians Ahead Of Olympics
-

Former Number One Momota Retires From International Badminton At 29
-

Why Insurance Prices Have Skyrocketed
-

World Bank Aiming To Connect 250 Mn Africans To Energy Grid By 2030
-

IMF Says Global Debt Levels Face 'Great Election Year' Risk
-

Divisions Among Colombia's FARC Dissidents Complicate Peace Talks
-

French Far Right Gets Youthful Vibe With 28-year-old Leader
-

US Fed's Powell Says Inflation Fight May Take 'Longer Than Expected'
-

Mideast-related Oil Price Spike Threatens 'Relatively Good' Economic Outlook: IMF Chief Economist
-

Wine Growers 'On Tip Of Africa' Race To Adapt To Climate Change


