

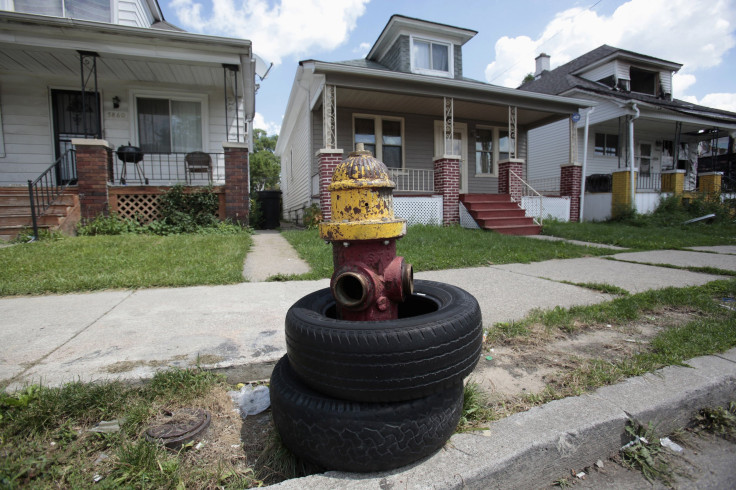
Wealthiest US Households Are Worth More Than They Were In 2003; Everyone Else Is Still Trying To Recover

While investors have been enjoying solid gains since the end of the Great Recession five years ago this month, a new study shows just how much wealth most American households have yet to recover. For the poorest households, debt has increased threefold since 2003, with recessionary effects lingering.
“Through at least 2013, there are very few signs of significant recovery from the losses in wealth experienced by American families during the Great Recession,” said the study released Wednesday by Russell Sage Foundation, the 107-year-old social science research organization. “These wealth losses, however, were not distributed equally.” The result: American wealth inequality has increased significantly in the past decade, with no sign of improvement.
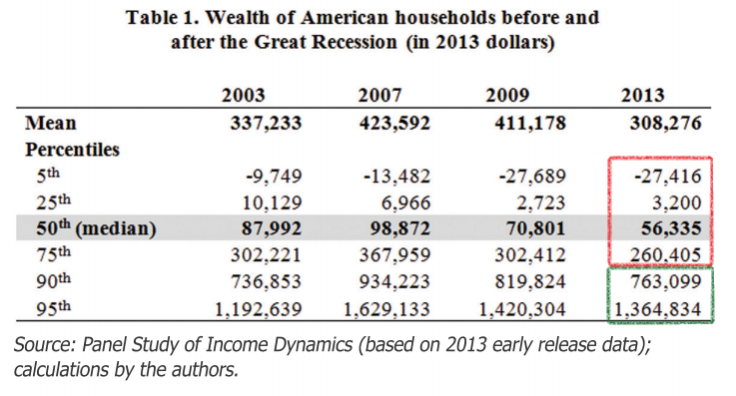
While the wealthiest saw the biggest losses in absolute terms, they’re earning more now than they were in 2003. Households in the top 10 percent income bracket lost an average of about $217,000 between 2007 and 2009, largely due to the housing crash and declines in investment income as the markets tanked. But the longest period of U.S. economic contraction since the Great Depression of the 1940s was only a temporary interruption in wage growth for America’s top earners. Today these households are worth about $100,000 more than they were a decade ago.
But the same cannot be said for the vast majority of Americans. Median household wealth – measured as total value of equity and income minus liabilities, such as credit card and mortgage debt – was about $99,000 in 2007, and today it’s a little more than $56,000.
The situation gets worse for below-median households. Wealth plummeted from about $10,000 in 2003 to $3,200 for the poorest 25 percent of U.S. households. For the bottom 5 percent, debt has nearly tripled to over $27,000.
Meanwhile, the Dow Jones Industrial Average has nearly doubled in five years, to 16,804. The S&P 500 has more than doubled in the same period, to 1,949. And the NASDAQ Composite is up 138 percent since June 2009.
While households with fat investment portfolios have seen a return to pre-rescession growth, most American households are still digging out of holes created by the sketchy mortgage lending and derivatives trading schemes of the mid-2000s that cost millions of working Americans their homes and jobs.
Read the full report here.
NOTE: The original story said the average household in the top 10% wealth bracket lost about $160,000 from 2007 to 2013. The averge loss for households in the top 90th and top 95th percentile combined was about $217,000 in that period of time.
© Copyright IBTimes 2024. All rights reserved.
-

Conflicts Push Military Spending To 'All-time High': Report
-

'Thank You, America:' Zelensky And Netanyahu Applaud House Passage Of Foreign Aid Package
-

Women Journalists Bear The Brunt Of Cyberbullying
-

US Aid Shows Ukraine Will Not Be 'Second Afghanistan': Zelensky
-

Elon Musk's X Fights Australian Watchdog Over Church Stabbing Posts
-

Glowering, Threats And Al Capone: What Faces The Trump Jury
-

IMF Calls On EU To Deepen Single Market Integration To Boost Growth
-

Haiti Sees Surge Of Deaths Amid Instability Crisis: UN Report
-

Ukraine, Israel, TikTok: The Massive Aid Package Before US Congress
-

Eiffel Tower Loses Sparkle For Parisians Ahead Of Olympics


