2014 Biggest Year For US IPO Market Since 2000, With Alibaba Leading The Way


Measured by either the amount of money involved or the number of deals done, the market for U.S.-listed initial public offerings had its biggest year in 2014 since 2000. One key driver was the IPO conducted in September by Alibaba Group Holding Ltd.: The behemoth weighed in at about $25.0 billion in the database maintained by the financial-software company Dealogic PLC and at about $22.0 billion in the database maintained by the manager of IPO-focused exchange-traded funds Renaissance Capital LLC.
Bearing in mind the two IPO-industry watchers interpret the relevant data in different ways, they compare 2014 and 2000 as follows:
- Between Jan. 1 and Dec. 16 last year, there were 288 IPOs with a dollar volume totaling $94.8 billion, according to Dealogic, based in New York. The comparable figures in 2000 were 432 IPOs and $104.6 billion, in that order.
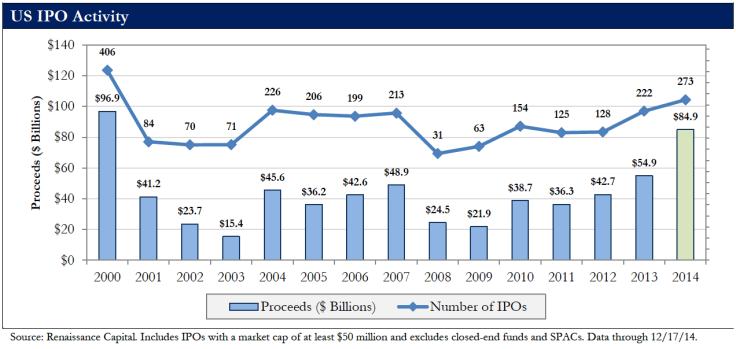
- From Jan. 1 and Dec. 17 last year, there were 273 IPOs with company proceeds totaling $84.9 billion, according to Renaissance Capital, headquartered in Greenwich, Connecticut. The comparable numbers in 2000 were 406 IPOs and $96.9 billion, respectively.
One difference between the Dealogic and the Renaissance Capital data universes centers on the fact the former counts all IPOs and the latter excludes closed-end funds and special-purpose acquisition companies, or SPACs.
Of course, these data are all so last year, and equity-market participants like to look not backward but forward. Renaissance Capital had this to say about that:
“Despite a handful of mostly small-capitalization IPOs that rose over 100 percent, investors hewed to strict valuation discipline, with 40 percent of IPOs pricing below the range. All this sets us up for a solid 2015 IPO market, as a healthy pipeline and still-positive US economic backdrop should support another year with more than 200 IPOs.”
© Copyright IBTimes 2026. All rights reserved.
- MOST POPULAR IN Business