China’s Consumer Price Index Rises A Little In July, As Its Producer Price Index Falls A Lot The Same Month

China’s consumer price index (CPI) advanced 1.6 percent and its producer price index (PPI) declined 5.4 percent in July, the National Bureau of Statistics reported Sunday. Because of the balance between deflationary and inflationary pressures, the country’s fiscal and monetary authorities appear well-positioned to do even more in the way of economic and market stimulus, consistent with that provided by the People’s Bank of China in a series of moves made during the past year or so.
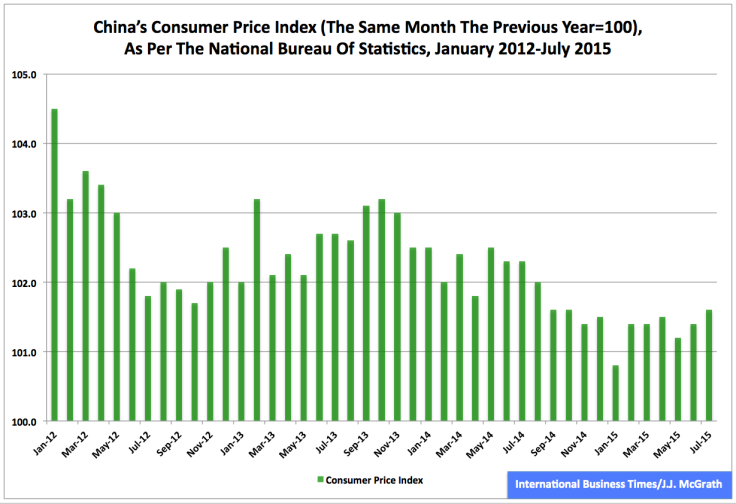
China’s CPI has been trending lower since January 2012, as shown by the above chart, but the country’s PPI has been trending even lower since the same month, as shown by the below chart. If rising consumer and producer prices indicate demand is greater than supply, then falling consumer and producer prices suggest supply is greater than demand.

The downtrend in China’s PPI has been more pronounced than the downtrend in the country’s CPI since January 2012. That month, producer prices were up 0.7 percentage point. The following month, they were flat. And every single solitary month since then, they were down.
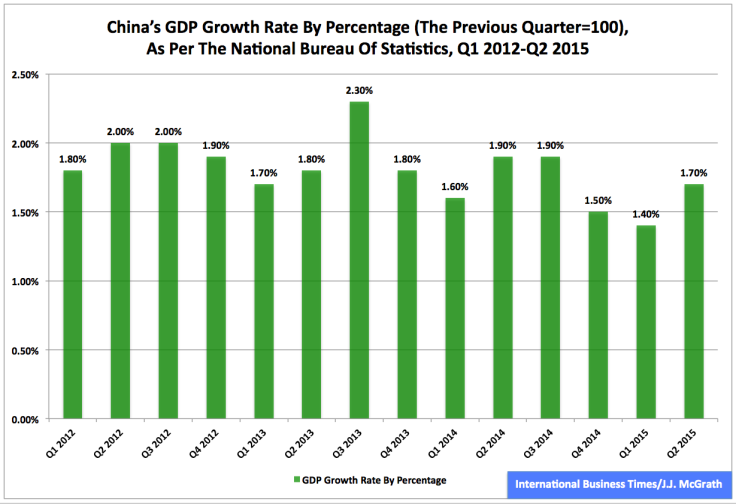
The People’s Bank of China already has done a great deal in moving the country’s monetary policy from loose to looser, but recent trends in the nation’s CPI, PPI and GDP may mean it might have to do even more along this line -- unless there is a complementary change in fiscal policy, which appears more unlikely than likely at present.
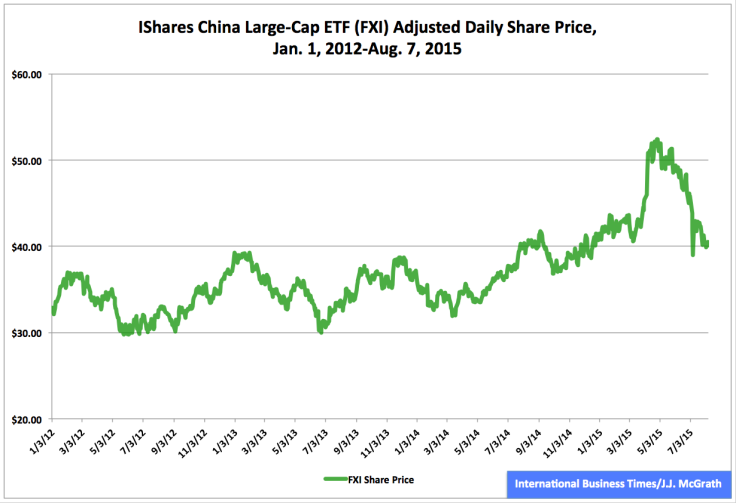
Meanwhile, China’s equity markets have had a roller-coaster year in 2015 to date, as shown in the above chart of one stock-market proxy well-known to many U.S.-based market participants, namely, the iShares China Large-Cap ETF, which tracks the FTSE China 50 Index. Because the index encompasses 50 of the largest and most liquid Chinese stocks listed on the Stock Exchange of Hong Kong, the ETF’s movements actually understate the volatility of the Chinese markets this year. Even so, its adjusted closing daily share price took a death-defying plummet to $40.53 Friday from $52.44 April 27, a plunge of -$11.91, or -22.71 percent.
© Copyright IBTimes 2025. All rights reserved.
- MOST POPULAR IN Business