

Civil Engineers Give US Infrastructure Near-Failing Grade

U.S. infrastructure — roads, bridges, rail, drinking water, waste water, solid waste and more—is close to flunking according to a recent assessment from the American Society of Civil Engineers (ASCE).
Once every four years, America’s civil engineers assess the nation’s infrastructure with an A to F report card. The engineers grade eight major categories: capacity, condition, funding, future need, operation, maintenance, public safety, resilience and innovation. This year’s grade average of all eight categories is a modest improvement, but hardly one to cheer about—it’s a D+ compared to a D in 2009. The nation’s infrastructure GPA has averaged in the D’s since 1998 for delayed maintenance and underinvestment across most categories.
“While the modest progress is encouraging, it is clear that we have a significant backlog of overdue maintenance across our infrastructure systems, a pressing need for modernization, and an immense opportunity to create reliable, long-term funding sources to avoid wiping out our recent gains,” the report states.
Solid waste earned the highest grade, a B-. Solid waste rates per capita remained steady over the past 20 years, but have declined in recent years. Inland waterways and levees earned the lowest grade, a D-. All categories either maintained their grades from 2009 or improved their grades slightly. Solid waste, drinking water, waste water, roads, rail and bridges all improved slightly.
City and state efforts to repair and update some of the nation’s most vulnerable bridges improved the bridge category, and short-term federal funding improved several categories. However, improvements are not all due to government. Increased private investment for efficiency and connectivity helped rail’s grade improve.
“We know that investing in infrastructure is essential to support healthy, vibrant communities,” the report states. “Infrastructure is also critical for long-term economic growth, increasing GDP, employment, household income, and exports. The reverse is also true – without prioritizing our nation’s infrastructure needs, deteriorating conditions can become a drag on the economy.”
Water categories are earning the worst grades.
Inland waterways, which carry the equivalent of 51 million truck trips each year, are largely hindered by unscheduled delays that drive up costs of goods. ASCE estimates there are an average 52 service interruptions every day. Most of the waterways haven’t been updated since the 1950s. Inland waterways earned a D-.
Aging dams and levees require estimated $21 billion and $100 billion investments respectively for repairs. The country’s 84,000 dams are an average 52 years old, and the number of high-hazard dams rose to 14,000 in 2012 and deficient dams to 4,000. The U.S. has about 100,000 levees, and the reliability of most is unknown, but levees helped prevent more than $141 billion in flood damages in 2011. Dams earned a D, and levees earned a D-.
Though the quality of drinking water in the U.S. is universally high, much of the drinking water infrastructure is more than 100 years old and nearing the end of its useful life. If every pipe needed replacement, the cost could exceed $1 trillion, according to the American Water Works Association. Drinking water earned a D.
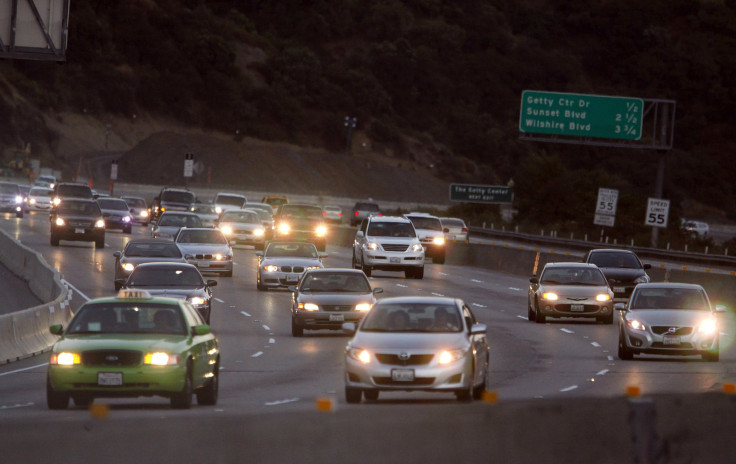
Grades in transportation also hover around a D. Aviation earned a D for costs of congestion in the air system, bridges earned a C+ for a backlog (though decreasing) of structurally deficient bridges, ports earned a C for a lack of federal funding, and roads and transit earned D’s for declines in conditions and performance. Rail improved the most with a C+, for increased investment and higher ridership.
“For the U.S. economy to be the most competitive in the world, we need a first class infrastructure system,” the report concludes.
© Copyright IBTimes 2025. All rights reserved.
- MOST POPULAR IN Business


