

Crude Oil Does The Limbo: How Low Can It Go?

The commodity market for crude oil may have been the one of the two most exciting financial markets around the world during 2014’s first 11 months. Crude’s price per barrel rose to a high of $107.95 June 20, according to Federal Reserve Economic Data, or FRED. And oil’s price per barrel fell to a low of $66.15 Friday, based on its January 2015 futures settlement price at the CME Group.
This breathtaking plunge of -$41.80, or -38.72 percent, has had and will have major -- and wildly uneven -- implications for crude-oil consumers and producers globally. Accordingly, both the winners and the losers in the new petroleum pricing game have stakes in attempting to contextualize where the commodity’s market has been, is and will be.
For example, airlines in the Asia-Pacific region generally have not yet pulled the trigger on hedging their aviation-fuel costs because they are waiting for crude prices to sink even lower, industry executives told Reuters Friday. Hedging historically has been employed by airlines to establish fixed costs or fixed ranges of costs for jet fuel, which the International Air Transport Association reported is their largest expense.
Understandably, the big dip in the oil price in the wake of the Organization of the Petroleum Exporting Countries meeting Thanksgiving Day had airline-industry execs in a holiday mood, as exemplified by AirAsia Bhd CEO Tony Fernandes, who posted on TMI.me that the drop was an early Christmas present for his company, which he described as “hardly hedged in 2015.”
Past performance is not necessarily indicative of future results, but it is helpful to look at the long-term trend in crude-oil pricing to assess where the market may move in the short to intermediate terms, as follows:
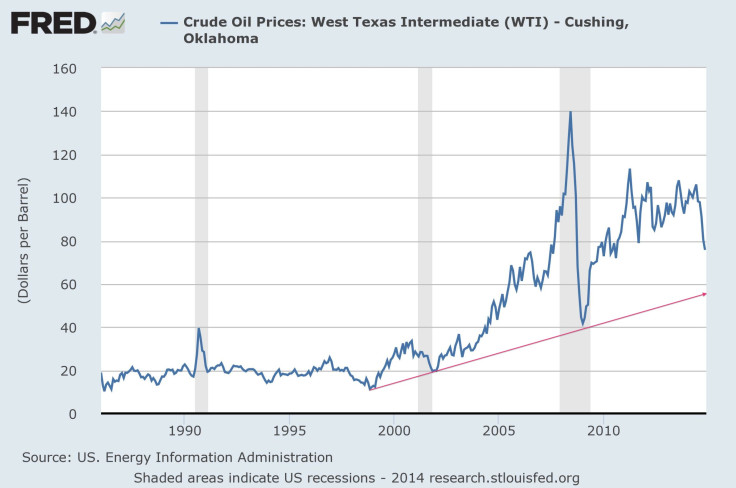
Clearly, the long-term trend in crude indicates it could bottom in the range from $50.00 to $60.00 per barrel, with the midpoint circa $55.00, as suggested by the red line on the above chart. Of course, one risk in this case is the fact oil is still mostly a U.S. dollar-denominated commodity. And the currency market for the American greenback might have been the other of the two most exciting financial markets around the world during 2014’s first 11 months, as follows:
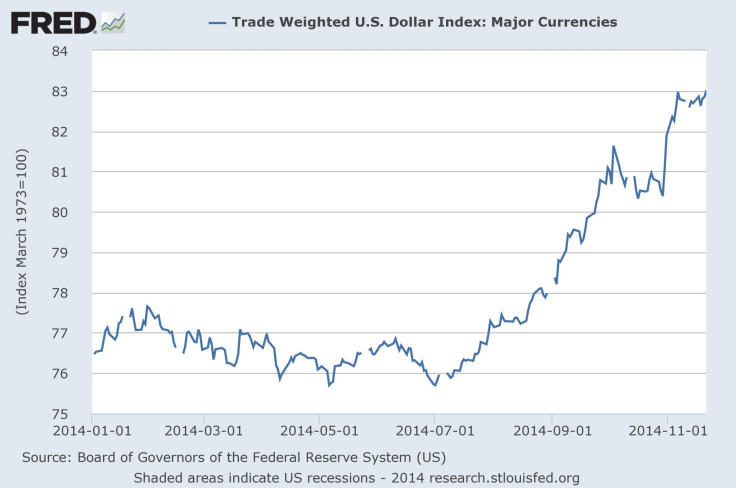
Here is an interesting thing about the comparative strength of the U.S. dollar and the comparative weakness of other major currencies, as shown on the above chart: The difference appears to be based to a large degree on a bias divergence on monetary policy between the Federal Reserve, oriented toward tightening, and other major central banks, oriented toward loosening.
And there is no indication this gap between the big central banks will be bridged any time soon, which means the crude-oil market could be in a funk for the foreseeable future.
© Copyright IBTimes 2024. All rights reserved.
-

Bitcoin And Crypto Price Review - Another Myth Gets Busted?
-

Mass Cancellations Loom Despite French Air Union Cancelling Strike
-

Mired In Crisis, Boeing Reports Another Loss
-

Recycled 'Zombie' Misinformation Targets US Voters
-

Hackers Leak Part Of Source Code Of El Salvador's Bitcoin Wallet
-

Azerbaijan Says 'Closer Than Ever' To Armenia Peace Deal Amid Border Talks
-

How UK's Biggest Water Supplier Sank Into Crisis
-

Taiwan Hit By Dozens Of Strong Aftershocks From Deadly Quake
-

Gaza Health System 'Completely Obliterated': UN Expert
-

In Ecuadoran Amazon, Butterflies Provide A Gauge Of Climate Change


