Gold Prices Blow Through 100-Day MA, ‘Elephants’ Still Trapped [CHART]
Gold prices fell below their 100-day moving average ($1,635) and barely stayed above their 200-day moving average ($1,525) as the decline continued on Monday.
Practitioners of technical analysis believe that once an asset moves below key moving averages like 100 days and 200 days, it has lost momentum and will likely fall further.
Much of gold’s recent plunge was forced, according to analysts.
Gold’s remarkable bull run in 2011 was partly built on the foundation of speculators, many of whom were highly leveraged through financial instruments like futures.
So when adverse events hit the gold market, many of these speculators were forced to sell.
In September, there were two adverse events.
One, global risk assets tumbled across the board, prompting the need for fund managers to be hit with redemptions and margins calls. Gold, along with many other assets, were sold to raise cash to meet these needs.
Two, the CME Group, the world’s largest exchange for gold futures, just announced a margin requirement hike. Back in August, it raised margin requirements twice.
An RBC Capital Markets report suggested that the liquidation may be far from over.
The report said the door “gold elephants” are trying to “squeeze through” is narrow, meaning large gold investors are trying to liquidate their positions to a market with very limited buyers.
“It seems painfully ironic that the very vehicle that investors sought to protect themselves from asset inflation in and of itself now looks to have experience inflated price points. In a finite market like gold, a small amount of money goes along way in terms of pricing impact,” stated the report.
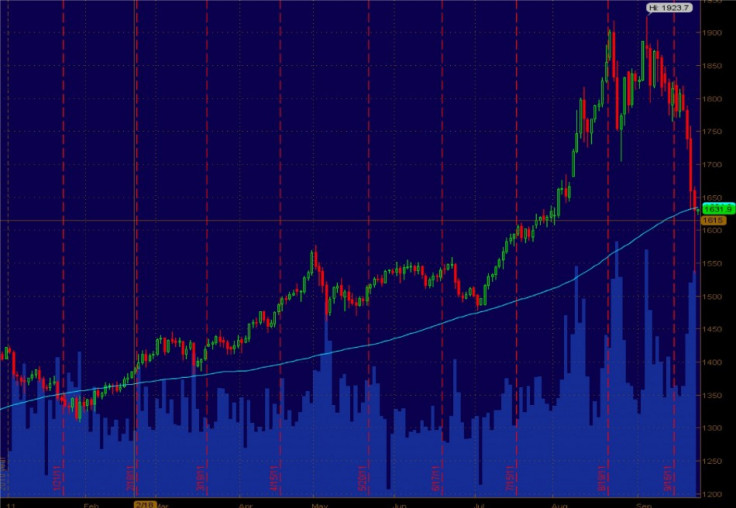
Below is a gold chart from thinkorswim with its 100-day moving average:
E-mail Hao Li at hao.li@ibtimes.com. For more useful global markets information, visit ibtimes.com/sections/global-markets.
© Copyright IBTimes 2025. All rights reserved.
- MOST POPULAR IN Global Markets