

Living Alone: More US Residents Forming Single-Person Households Than Before [CHARTS]

More Americans are living alone than ever before, according to a new U.S. Census Bureau report that looks at how families and living arrangements have changed over time.
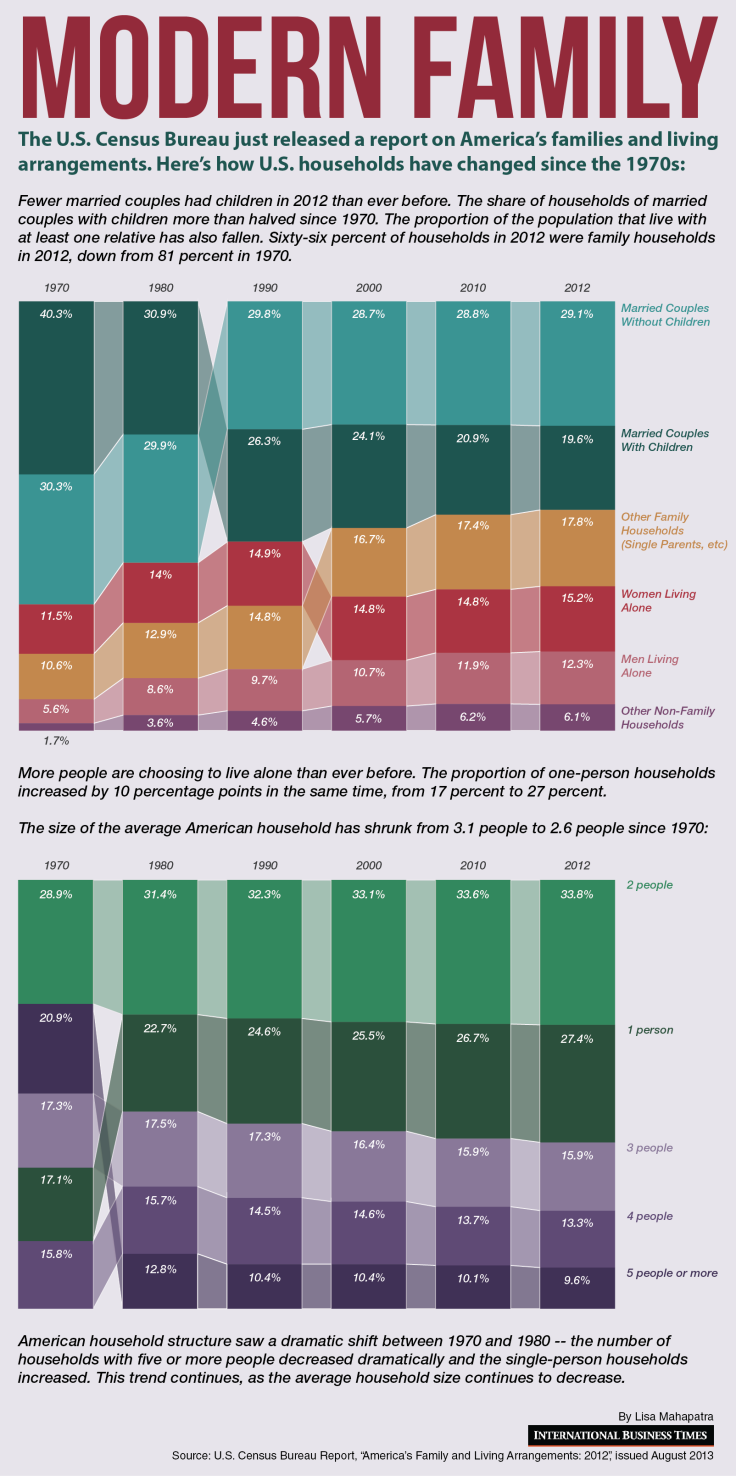
In 1970, only 17 percent of the U.S. population was living alone. By 2012, the proportion of single-person households increased more than 10 percentage points, to 27.4 percent.
The share of households that were married couples with children has halved since 1970, from 40 percent to 20 percent, according to the report.
The study also found that partners in heterosexual marriages were less likely to be of different races than unmarried heterosexual couples. Black and Hispanic children were far more likely to live with one parent than non-Hispanic white children and Asian children.
Households started to shrink significantly in the 1970s, and that trend continues. The average number of people per household has fallen from 3.1 in 1970 to 2.6 in 2012.
Here’s are a couple charts that show how these changes took place:
© Copyright IBTimes 2026. All rights reserved.
- MOST POPULAR IN Business


