

Mars Interactive Maps Go Beyond Just Data And Visualization [INTERVIEW]

The mission of an interactive map of Mars: Be cool, engaging and above all, shareable. That's how Eric Rodenbeck describes how his team at Stamen Design approaches its work creating maps from publicly available NASA data, among many projects. IB Times talked to the Stamen founder and CEO about the process.
The San Francisco-based firm's goal is to create "compelling interactive design and data visualization projects" and straddle the line between design firm and research and development group, he says. Previous work has included using data from Facebook to create maps of music consumption from users and collecting city data to map out health care coverage and crime.
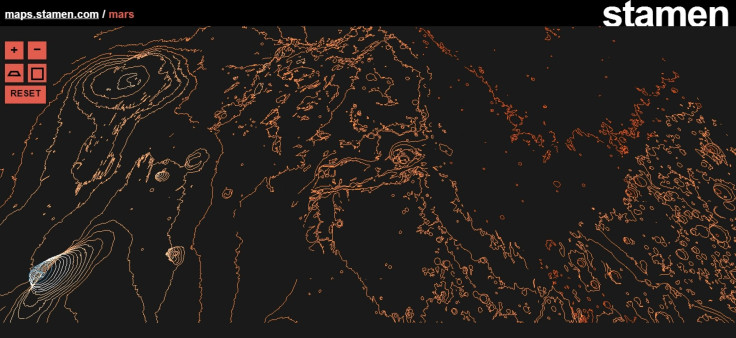
For the Mars maps, Stamen used data from NASA's Mars Orbiter Laser Altimeter, or MOLA, launched in 1996, and mapped the planet over the course of four and a half years. MOLA used an altimeter to measure the altitude of surface features, such as cliffs, mountains and valleys, found on Mars. The data collected helped determine the height of different surface features, which could help future research on Mars, including that of the Curiosity Rover.
Reseaching space is almost as popular as exploring it. With numerous research projects from NASA, including orbiting satellites mapping a planet's surface, there is a large amount of data that needs to be processed. For Rodenbeck, this data needs to be deciphered and presented in a way that's easy to digest, learn from and, most importantly, share. "Space has all kinds of interesting opportunities," Rodenbeck said. "In particular, we think that the very large images created by new satellites are perfect candidates for the combination of mapping technology, aesthetic considerations, and easy linkability and sharability that projects like these display. The size alone of these images, as well as the technology that goes into making them, really requires a kind of viewing platform that maps can help with."
A map is not the end of a project, or even a solution to a particular problem or question. Rodenbeck believes mapping projects can open up new research avenues and create a host of new questions. Rodenbeck says maps are "also about generating whole new kinds of questions, questions you can't even articulate without something visual to point at." With the influx of new science research, and the limited resources in presenting them, it's important that research projects can get translated into something everyone can understand and get excited about.
Another interesting thing about maps and these projects is what happens once they are available on the Internet. Sometimes Internet users use a project in a way that's totally unexpected, notes Rodenbeck. He says, "Access is key, so that people can approach the work in their own way and draw their own conclusions. Visualization, when it's public on the Internet, has the capability to engage people on multiple levels."
In regards to the map design itself, being attractive is important because it allows users to feel comfortable with what's being presented. If a map of Mars features numerous details and important information about surface features but appears cluttered, viewers may be turned off from exploring further. Rodenbeck says, "For us, if it's beautiful but not clear, the design has failed. What we strive for is to make something that's immediately, intuitively visually engaging, so that you stop what you're doing and give it a second glance. Once you're there, you're much more likely to stick around long enough to have an experience that rewards repeat viewing."
This idea of a repeat experience is crucial to Rodenbeck's design philosophy. He makes the distinction between infographics and other ways of data visualization, saying repeat viewing experiences are "different than making something that can be entirely understood in a single glance. Down that road lies infographics and silly pictures. Science is complicated, [and] so is the world, and we try to bring that complexity to light in a way that's delightful as well as informative."
© Copyright IBTimes 2024. All rights reserved.
- MOST POPULAR IN Science


