

Rates of Uninsured Drop In Every State: US Census Bureau Health Insurance Report

The number of Americans who carry no health insurance declined sharply in 2013 and 2014, after years of relatively little change, the U.S. Census Bureau said Wednesday. During the same period, the percentage of the population without health coverage shrank in every state, and in the District of Columbia.
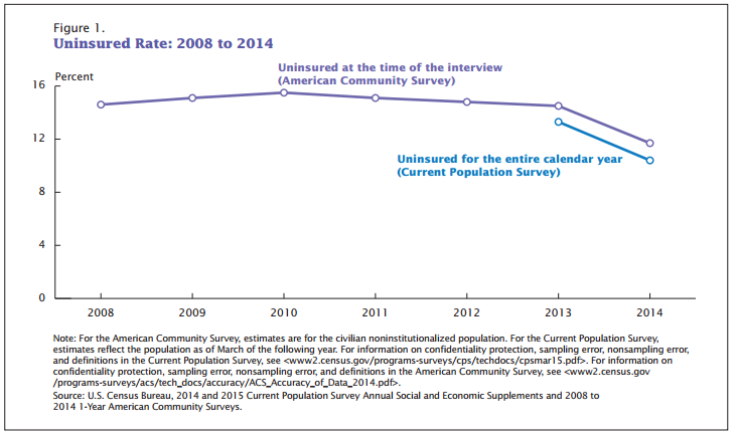
The Census Bureau's new report on health insurance coverage shows that the rate of people with no coverage for the entire year dropped from 13.3 percent in 2013, to 10.4 percent in 2014 -- a 2.9 percent decrease, as measured by the Current Population Survey Annual Social and Economic Supplement.
According to another survey the Census Bureau uses to capture trends, the American Community Survey (ACS), the rate of the uninsured ranged from 14.5 percent to 15.5 percent between 2008 and 2013. The ACS, which measures whether or not someone has insurance at the time they are interviewed, recorded a similar drop (2.8 percent) in the uninsured rate in 2014 -- "marking the largest percentage-point decline in the uninsured rate" since 2008, the Census Bureau said.
In terms of population count, 33 million people were uninsured for the entire calendar year in 2014, compared to 41.8 million people who were uninsured in 2013. For the report, the Census Bureau defines health insurance coverage as private insurance -- such as through an employer, or a plan purchased directly by an individual -- or government insurance -- such as Medicare, Medicaid, and state health plans.
The percentage of the population with health coverage expanded, from 86.7 percent in 2013 to 89.6 percent in 2014. The rates of coverage went up for both private insurance (a 1.8 percent increase, to 66 percent) and government insurance (a 2 percent increase, to 36.5 percent).
The report highlights the role of the Patient Protection and Affordable Care Act (ACA) -- President Obama's signature health care reform law -- in explaining the changing rate of those who don't have health insurance. The "decreases in the uninsured rates between 2013 and 2014 are consistent with what some provisions of the ACA intended," the Census Bureau said.
While the "ObamaCare" law was passed in 2010, key provisions, including expanded Medicaid eligibility and the launch of health insurance marketplaces in different states, did not take effect until Jan. 1, 2014.
“Between 2013 and 2014, the greatest changes in coverage rates were the increases in direct-purchase health insurance and Medicaid," the report said. Direct-purchase insurance covered 14.6 percent of people during some or all of 2014 (a 3.2 percent increase from the prior year). Medicaid coverage-- which provides insurance to low-income earners --increased to 19.5 percent of people for some or all of 2014 (up 2 percent from 2013).
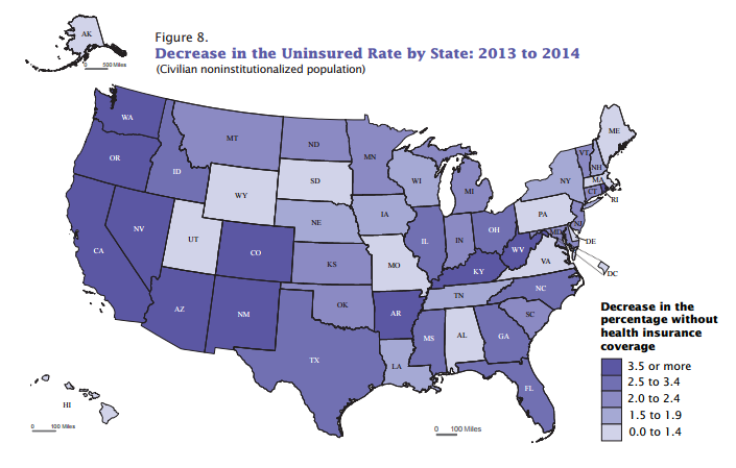
Not all states chose to expand Medicaid eligibility under the Affordable Care Act, the Census Bureau noted a 3.7 percent difference in the uninsured rate between those that did, and those that did not. In so-called "expansion states" the collective uninsured rate was 9.8 percent in 2014, compared to 13.5 percent who were uninsured in states that didn't expand eligibility.
"The uninsured rates by state ranged from 3.3 percent (Massachusetts) to 15.2 percent (Nevada) in expansion states, and from 7.3 percent (Wisconsin) to 19.1 percent (Texas) in non-expansion states," according to the report.
© Copyright IBTimes 2024. All rights reserved.
-

Panama Papers Law Firm Boss Ramon Fonseca Dead
-

Pandemic Agreement Talks Go To The Wire
-
Low-cost MRI Paired With AI Produces High-quality Results
-

School's Out: How Climate Change Threatens Education
-

Hong Kong Demands Online Platforms Remove Banned Protest Song
-

2023 'Year Of Record Climatic Hazards' In Latin America: UN
-

Crypto Community Buzzes As Grayscale Withdraws Ethereum Futures ETF Application
-

Mongolia's Wildlife At Risk From Overgrazing
-

Milking Venom From Australia's Deadly Marine Animals
-

TikTok Challenges Potential US Ban In Court


