

Stock Market Slump: Why September Is The Worst Month For Stocks

As the apocryphal story goes, business titan J.P. Morgan enters an elevator and the liftboy asks what to expect in the stock market that week. The magnate’s response: “It will fluctuate, my boy.”
With a little more historical data, Morgan could have been somewhat less glib. The market doesn’t fluctuate equally at all times. The three-month period between August and October happens to be the most volatile of the year. And September, on average, sees a drag in equities.
Those patterns have attracted analysts’ attention in recent weeks as the stock market has bounced through a particularly choppy patch. A series of selloffs in late August left the Dow Jones Industrial Average down 6 percent for the month, some losses since recouped by sporadic gains.
Though the turbulence has been largely attributed to gathering signs of global economic malaise led by China’s worsening downturn, analysts are keen to point out increased volatility and sudden selloffs aren’t atypical for late summer. As the eminent MIT finance professor Andrew Lo told Bloomberg in a recent interview on the market’s latest woes: “August sucks.”
The jumpiness in the stock market is measured both in statistical volatility -- the relative size of ups and downs of the stock market -- and through “implied volatility,” measured by the CBOE Volatility Index (VIX), which is calculated from futures prices and better indicates trader sentiment.
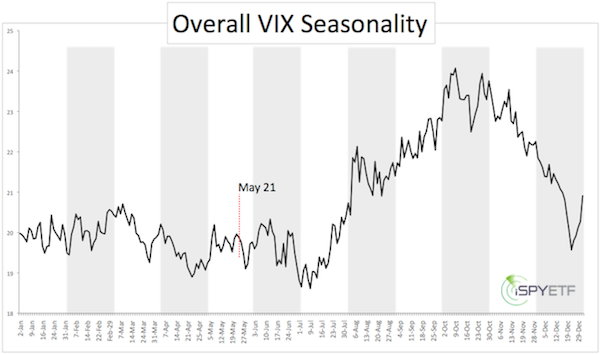
Historical patterns in the VIX show implied volatility in the stock market increases through late summer, peaking in October, as the chart below from iSPYETF illustrates. The well-known phenomenon has given these months a dubious reputation on Wall Street, particularly with memories of crashes like those of 1929 and 1987.
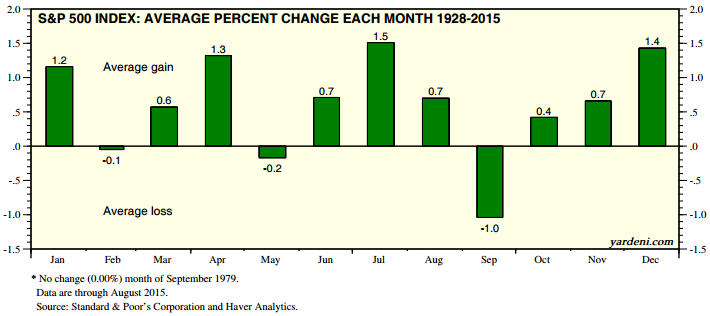
September, meanwhile, has the distinction of being the worst-performing month over a historical time span. According to an analysis by Yardeni Research, 47 Septembers have ended in the red since 1928, with only 39 eking out gains -- the only month to dip more often than it rises. On average, September brings a 1 percent drop in the S&P 500.
Do these patterns reflect fundamentals or sentiments? It should strike no one as surprising that short-term stock swings often bear little connection to the underlying profitability of the companies being traded. But exactly why these months stick out remains unresolved.
Sam Stovall, equity strategist for S&P Capital IQ, has argued investors tend to ditch lackluster stocks before third-quarter earnings results start trickling in. Others have suggested traders who follow the old dictum “Sell in May and go away” return from their Labor Day sojourns eager to sell off positions that have since become undesirable. These patterns may also account for greater volatility as summer gives way to fall.
Whatever the culprit, September’s poor reputation has investors on edge in 2015, with its potent mix of global and domestic uncertainties. Not only are emerging economies the world over turning in lackluster numbers, but it remains entirely unclear when the Federal Reserve will begin notching up near-zero interest rates.
Not all was bad in midday trading Tuesday, however. The S&P 500 was up 1.7 percent for the day as of press time. Still, the index has slumped 0.7 percent since the start of September.
© Copyright IBTimes 2024. All rights reserved.
- MOST POPULAR IN Business


