

Infographic: Coronavirus Crash Not (Yet) As Bad As Previous Downturns
Considering the carnage we’ve seen over the past three weeks, it’s hard to believe that the U.S. stock market was at an all-time high just one month ago. On February 19, the S&P 500 closed at 3,386 points, yet another record, and the coronavirus outbreak was largely confined to China, a mere side note in the constant stream of news we’re all exposed to. Just a couple of days later, as news of the virus spreading outside of China emerged, things took a sharp turn for the worse and markets started to tumble.
Four weeks later, the COVID-19 outbreak has turned into a full-fledged pandemic and large parts of Europe and the United States have come to a near standstill, wreaking havoc on the world economy and on stock markets across the globe. Since said February 19, the S&P 500 has dropped by almost 1,000 points and we’ve seen some of the worst single-day losses in U.S. stock market history.
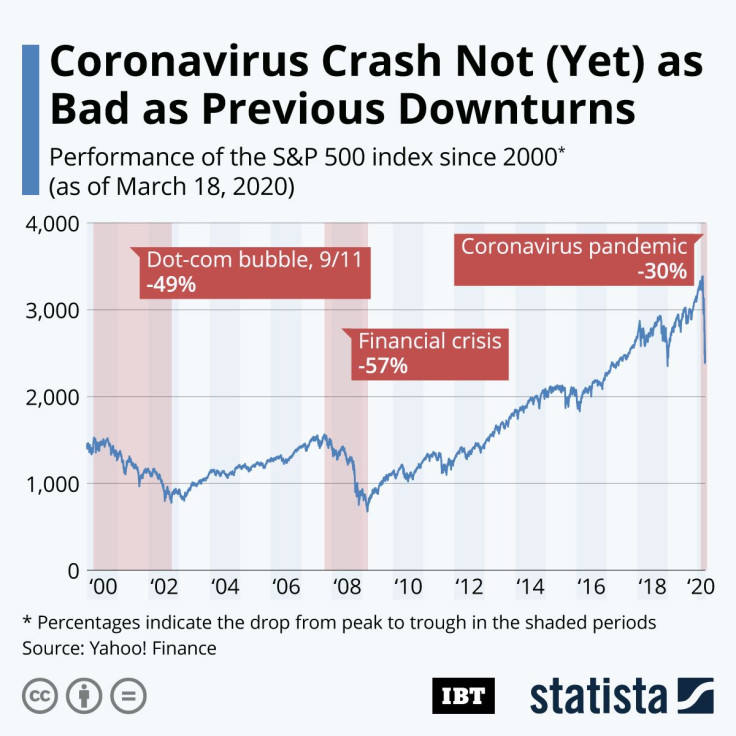
As the following chart shows, the drop we’ve seen over the past weeks is already substantial but it’s not yet as deep as it was when markets hit rock bottom during the worst crises of the 21st century. Considering that we’re only a few weeks into the pandemic, and the economic fallout of the measures currently taken to stop it is yet unpredictable, the current crisis could well turn out to be as disruptive as the financial crisis of 2007-2009.
- MOST POPULAR IN Business


