

Over Decade Of Global Forest Change Mapped By Google Earth

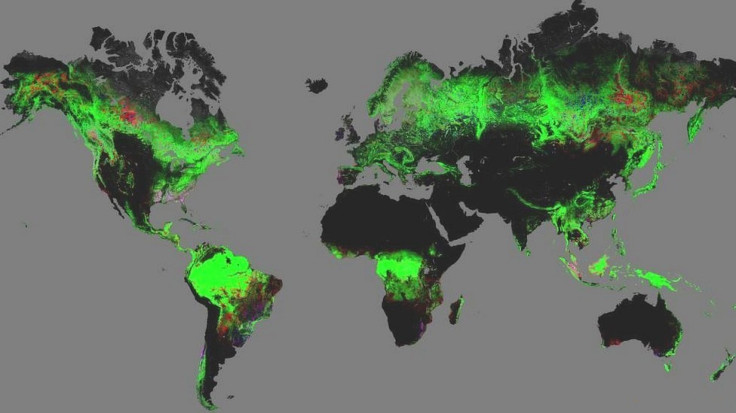
Google Earth has helped create an engaging, high-resolution map that shows global forest loss and gain.
The map tracks changes in the world’s forests during the years 2000 to 2012. Available to the public, it was created from satellite data and has the ability to zoom in to the high resolution of 30m, reports BBC News. The team that designed the map was led by Professor Matthew Hansen of the University of Maryland.
"This is the first map of forest change that is globally consistent and locally relevant," said Hansen. "What would have taken a single computer 15 years to perform was completed in a matter of days using Google Earth Engine computing."
The map highlighted great forest losses in Indonesia, Malaysia, Paraguay and Angola, said a study on the project in the journal Science. Brazil, on the other hand, saw successful reduction in deforestation. The study reveals that the huge South American country, home to most of the Anazon rain forest, reduced forest loss in half between 2003 to 2004 and 2010 to 2011.
On Thursday, though, Brazil’s environment minister called for urgent action in the country against double-digit increases in deforestation there, reports AFP. Environment Minister Izabella Teixeira cited official data that covered August 2012 to July 2013, revealing accelerating deforestation across the country.
Researchers say tropical forest loss is increasing overall by around 2,100 sq km per year. And as the result of logging, fire, storms or disease, Earth lost a total of 2.3 million square kilometers of tree cover over the 10 years represented in the data. According to the team, the map will be updated each year and could be a helpful tool in monitoring deforestation effects.
© Copyright IBTimes 2025. All rights reserved.
- MOST POPULAR IN Science


