

Apple Inc.'s iPhones And iPads Dominate Holiday Sales With Half Of All Christmas Device Activations

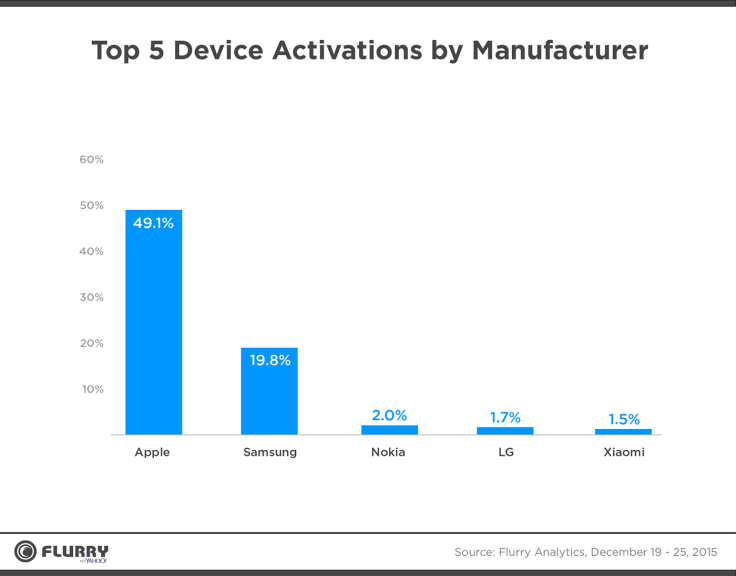
If you unwrapped a smartphone or tablet this Christmas, there’s a nearly one in two chance that it was an iOS device. Between Dec. 19 and Dec. 25, Apple’s iPhones and iPads took the lion’s share of device activations with over 49 percent share, according to the latest metrics from Yahoo’s data analytics arm, Flurry.
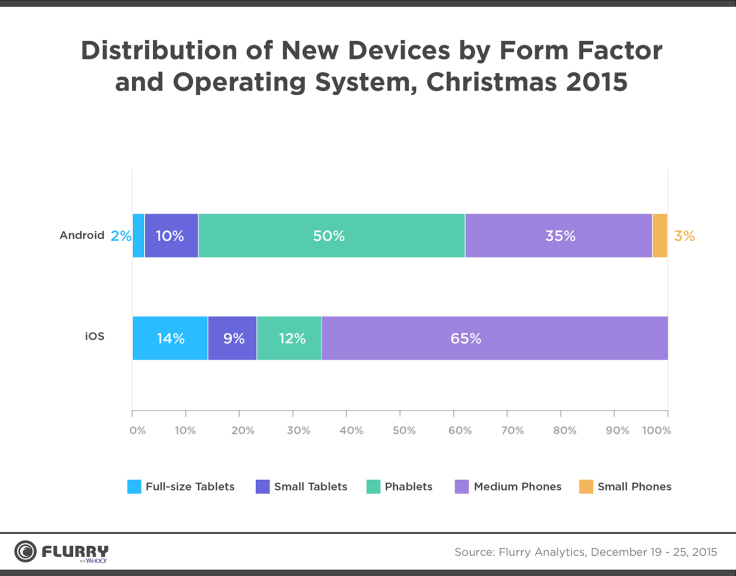
Samsung was a distant second with nearly 20 percent share, and Nokia, LG and Xiaomi trailed even further behind with shares of 2 percent and below. On iOS, medium sized smartphones — like the 4.7-inch iPhone 6S — were the most popular devices activated. But on Android, phablets, smartphones with displays between 5.1-inches and 6.9-inches, took nearly half of the device share.
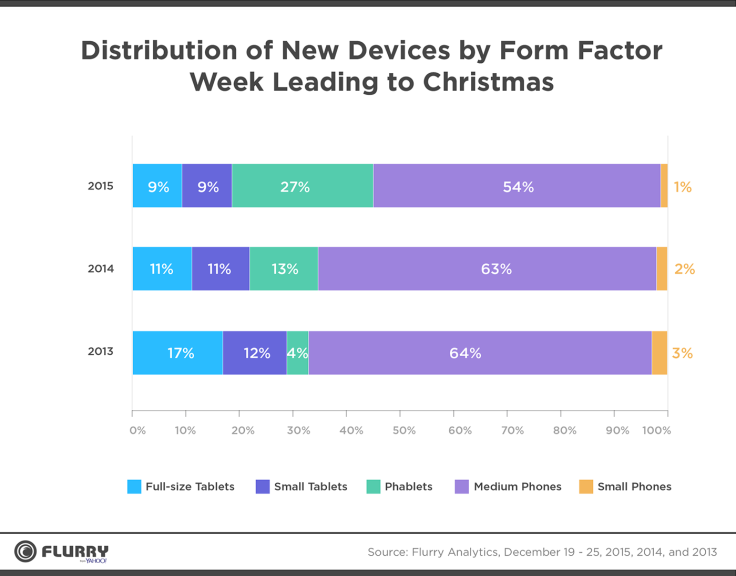
Overall, phablets have continued their rise for devices activated during the holidays, with the category’s share doubling to 27 percent — up from 13 percent last year. That largely came at the cost of share from medium phones and small tablets. Despite Apple’s continued dominance of Christmas device installs, it did see a 2.2 percent drop in activation share compared to last year, with Samsung gaining 2.1 percent share.
Tablets as a whole have continued to lose share as customers increasingly opt for phablets. That’s despite Apple’s November launch of the 12.9-inch iPad Pro, which accounted for less than 1 percent of device activations, according to Flurry.
On the app side, Flurry also saw app downloads on Christmas Day surge to an average of 2.2 times as many app installs compared to average daily installs between Dec. 1 and Dec. 21. Flurry’s methodology was based on data collected from 780,000 apps it tracked between Dec. 19 to Dec. 25.
© Copyright IBTimes 2024. All rights reserved.
- MOST POPULAR IN Technology


