

NASA’s Aquarius Map Helps Detect Climate Change
NASA's new Aquarius instrument has produced its first global map of the salinity of the ocean surface, NASA reported on its website Sept. 22.
This is the first map of its kind, officials said that may prove to be beneficial in terms of understanding climate change.
Salinity changes are linked to the cycling of freshwater around the planet and influence ocean circulation, according to NASA.
Because that pattern of ocean currents is what determines how much heat and carbon the ocean stores and that in turn determines how fast the climate warms, said scientist Steve Rintoul, who has been measuring currents between Australia and Antarctica, in an article for ABC News Australia.
Decreases in ocean salinity could be a sign that ice in Antarctica or elsewhere may be melting more rapidly. Once the waters freshen and the rate at which water sinks slows, an impact on the environment might be detectable.
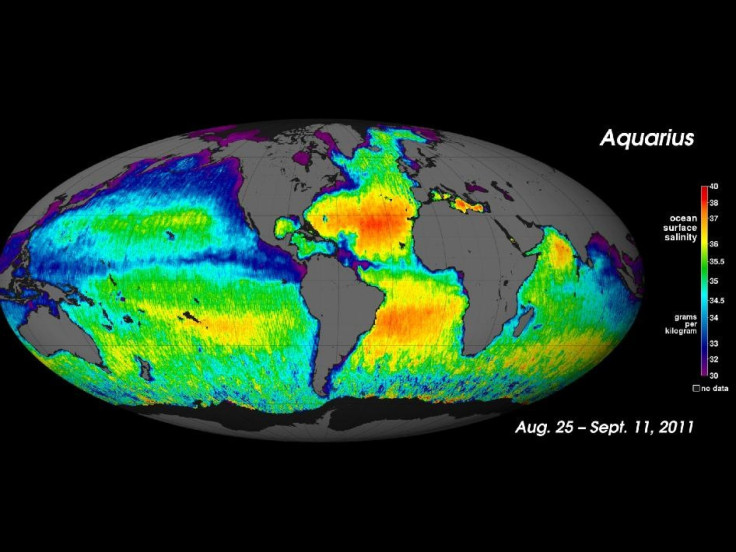
The Aquarius map shows higher salinity in the subtropics; higher average salinity in the Atlantic Ocean compared to the Pacific and Indian oceans; and lower salinity in rainy belts near the equator, in the northernmost Pacific Ocean and elsewhere, according to NASA.
The map showed a sharp contrast between the arid, high-salinity Arabian Sea and the low-salinity Bay of Bengal. It also revealed greater-than-expected extent of low-salinity water associated with the outflow from the Amazon River.
In the past, this sort of information was typically collected by lowering instruments from ships into the middle of the ocean. However, oftentimes the data were not of the best quality.
NASA launched the Aquarius satellite earlier in 2011 equipped with a number of instruments whose sole purpose is to collect information about the environment.
© Copyright IBTimes 2025. All rights reserved.
- MOST POPULAR IN Science


