

Cheap Tickets And Flights: Is The Passenger Next To You Paying Less Than You Are?
For most modern travelers, airfare pricing is a mystery. But one thing’s for certain: Not everybody is paying the same price for the same ticket. A new study by travel-planning site Hopper found that the spread between the lowest and highest economy fares on a single return flight in the U.S. can vary by as much at $1,400.
The study also identified Washington, D.C., as the domestic destination with the most variability in ticket pricing, while Amsterdam is the top international destination for fare variability. That is, on any given flight to either of those cities, chances are the passengers will have paid wildly different prices for their tickets. (The destinations with the most stable pricing were Kahului, Hawaii, and Kingston, Jamaica.)
“Airline prices change all the time,” said Hopper’s chief data scientist, Patrick Surry. “We gather real pricing data from millions of consumer searches every day. But the more consumer and vacation-oriented destinations tend to have less variability than business-oriented ones, presumably because consumers are more price-sensitive as well as more flexible about dates and places.”
The flights with a higher variability in pricing are the ones where you have opportunities to score a good deal, he added. “But if you wait too long to buy, you’re probably going to overpay a lot more as well.”
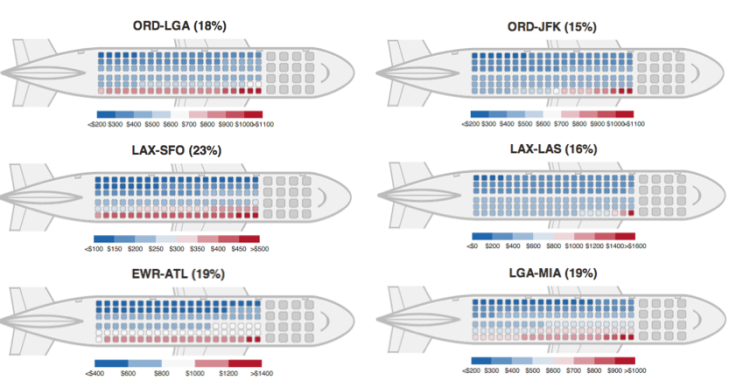
Surry’s team studied the entire history of prices quoted for round-trip airfares in six different itineraries over a weekend in May: Los Angeles to Las Vegas, Los Angeles to San Francisco, Chicago to New York LaGuardia, Chicago to New York JFK, Newark to Atlanta, and New York to Miami.
The itinerary with the lowest spread in pricing was Chicago O’Hare to New York JFK, in which pricing varied by 15 percent. The one with the most fluctuation in airfare pricing was Los Angeles to San Francisco, with a variability of 23 percent.
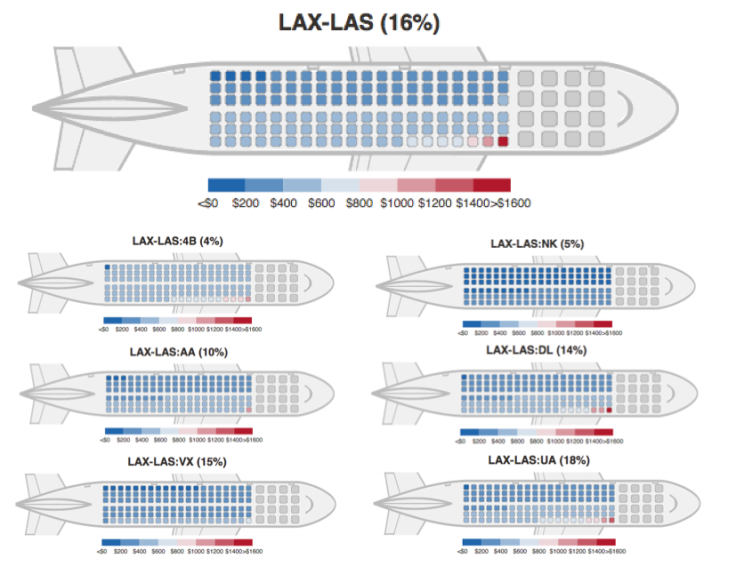
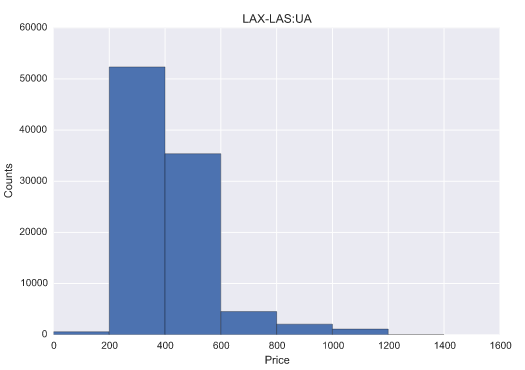
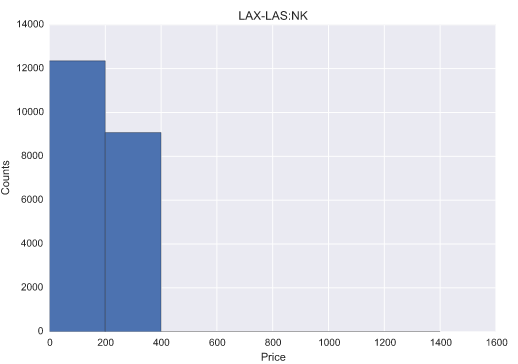
Hopper also took a deeper look at the flights between Los Angeles and Las Vegas, in which ticket prices varied from just under $200 to more than $1,600 for the same type of ticket. Most tickets were priced for less than $600, said Surry.
But variability often depended on the airline quoting the fares. Olson Air Service, a domestic regional carrier, offered the most consistent prices, with just a 4 percent variability, while United Airlines quoted fares that varied by 18 percent.
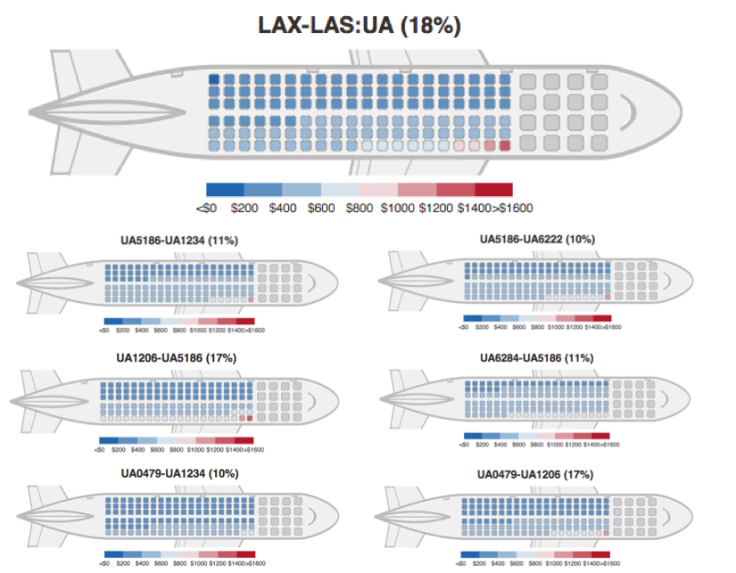
But price distribution even varied on the various flights offered by United throughout the day. The chart below illustrates the price distribution of tickets by flight. “Some flight times may be more desirable than others, which is probably why they have more variability. As the travel date draws nearer, consumers are likely to pay more for those tickets,” said Surry.
So how can consumers use this information when planning their next trip? The more you know how much the spread is in pricing for a particular route, the more likely you are to recognize a good price, says Surry. To find out how much prices vary on a specific route, try Hopper’s research tool.
Domestic Destinations with the Most Stable Prices
1. Kahului (OGG)
2. Honolulu (HNL)
3. Orlando (MCO)
4. West Palm Beach (PBI)
5. Indianapolis (IND)
6. Columbus (CMH)
7. Fort Lauderdale (FLL)
8. Tampa (TPA)
9. St. Louis (STL)
10. Baltimore (BWI)
Domestic Destinations with the Most Variability in Prices
1. Washington (IAD)
2. Chicago (ORD)
3. Myrtle Beach (MYR)
4. Oakland (OAK)
5. Los Angeles (LAX)
6. Santa Ana (SNA)
7. New Orleans (MSY)
8. Chicago (MDW)
9. Kansas City (MCI)
10. Washington (DCA)
International Destinations with the Most Stable Prices
1. Kingston (KIN)
2. Guadalajara (GDL)
3. Montego Bay (MBJ)
4. Mexico City (MEX)
5. Cancun (CUN)
6. Santo Domingo (SDQ)
7. San Salvador (SAL)
8. Punta Cana (PUJ)
9. Nassau (NAS)
10. San Jose Del Cabo (SJD)
International Destinations with the Most Variability in Prices
1. Amsterdam (AMS)
2. Beijing (PEK)
3. Toronto (YYZ)
4. Istanbul (IST)
5. Athens (ATH)
6. Rome (FCO)
7. Paris (CDG)
8. Manila (MNL)
9. Dublin (DUB)
10. Shanghai (PVG)
© Copyright IBTimes 2024. All rights reserved.
- MOST POPULAR IN Travel


