

Hiding Something From The IRS? Stay Away From Houston Or San Francisco (And Don’t Be Rich)

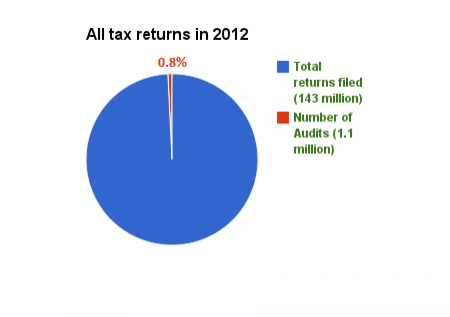
Tax season is over, but audit season never ends. The latest annual report by the National Taxpayer Advocate – the Internal Revenue Service’s ombudsman (or in this case, ombudswoman) – has lots of gems, including how frequently the IRS audits, how getting rich increases your chances of an audit, and what parts of the country experience the most audits.
National Taxpayer Advocate Nina Olsen outlined a series of problems with the current tax code, including familiar refrains about the complexity and time-consuming aspects of filing, as well as funding issues that, according to the NTA, mean one out of three taxpayers are unable to get through to an IRS representative by phone.
Olsen also singled out the Alternative Minimum Tax.
“Only under the unique logic of the AMT are the acts of having a large family and living in a high-tax state viewed as a tax dodge. As we document in this report, the AMT does not seem to achieve its intended purpose.”
Buried in the report are also some interesting details about the world of tax compliance and enforcement, including:
The U.S. tax code is 4 million words long. That’s more than four times as many words as the Bible.
Individuals and businesses spend a cumulative 6.1 billion hours annually – the equivalent labor of three million full-time employees per year – complying with tax laws.
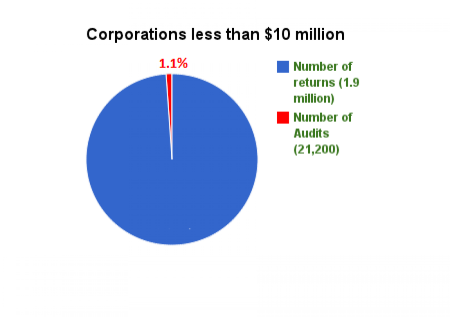
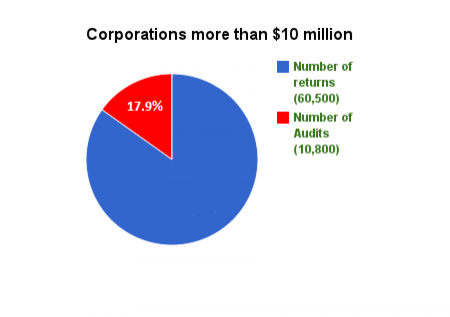
Here are two charts showing how the IRS treats corporation with income of less than and more than $10 million.
Since 2001, the tax code has been subjected to 4,680 changes.
The tax code is so complex that 59 percent of taxpayers are forced to pay professionals to file taxes on their behalf.
The IRS has a backlog of 650,000 unresolved identity theft cases.
As far as tax cheats are concerned, the NTA report said owners of construction companies and real estate rental firms are more likely to cheat on their tax filings than those involved in other industries.
And as far as the geographic dispersal of areas with the highest number of tax cheats: California is home to one-third of the more than 350 clusters that are more likely to be home to tax evaders, especially in communities in and around Los Angeles and San Francisco.
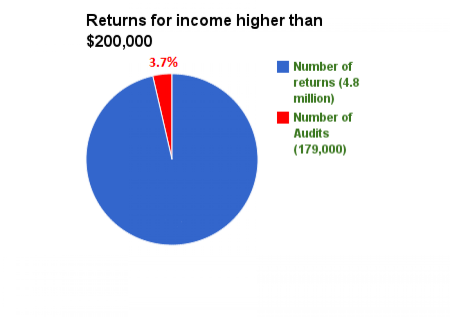
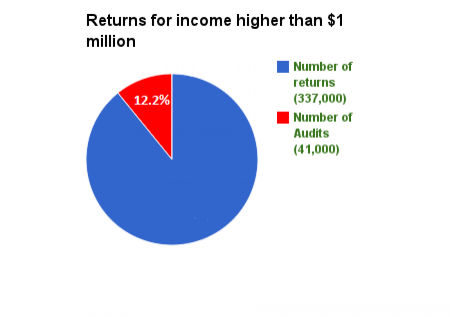
Other tax cheat-laden communities include (probably much to no one’s surprise) the suburbs around Washington, D.C. Communities in and around Houston and Atlanta were also singled out. Many of the areas are high-income, including Beverly Hills and Newport Beach, Calif. Part of the reason could be that wealthier Americans are more likely to face audits, and therefore communities that house them are more likely to face audit scrutiny.
Where were the most honest taxpayers? The Midwest and the Northeast, according to the report, are relatively clean compared to the other regions.
© Copyright IBTimes 2025. All rights reserved.
- MOST POPULAR IN World


