The US Spends Less On Food Than Any Other Country In The World [MAPS]

U.S. residents spent on average about $2,273, or about 6.4 percent of their annual consumer expenditures, on food in 2012, according to the United States Department of Agriculture (USDA).
As a percentage of consumer expenditures, that is less than any of the 83 other countries for which the USDA tracks data.
That doesn’t mean food is cheaper in the U.S. than anywhere else in the world. In fact, the annual cost of food in the U.S. is more than the average of all the countries for which data is tracked by the USDA.
It means that the average amount spent on food, when expressed as a percentage of all the consumer goods the average U.S. citizen purchases in a year, is less than in any of these other 83 countries.
This percentage is the highest in Pakistan, where the average person spends about half his/her annual income on food. This is despite the fact that food for one person in a year in Pakistan costs about a fourth of what it costs in the U.S.-- $415.
But even high-income countries, like Switzerland (11 percent) and Sweden (12.2 percent), spend a higher percentage of their annual consumer expenditures on food than U.S. residents do.
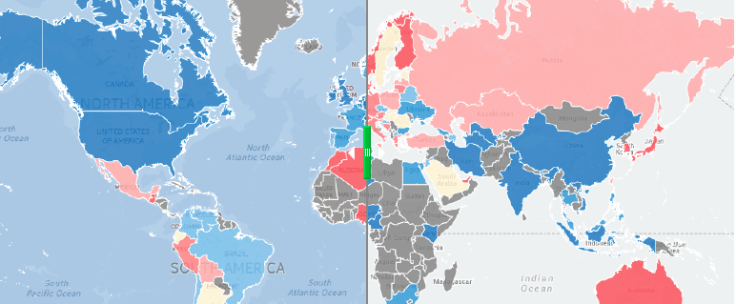
Here’s a map of countries, color-coded by the percentage of annual expenditures on food. Click on any country for more info:
Of all these countries, food is the cheapest in India. The average person spends $220 a year on food, and that is equivalent to 25.2 percent of the average annual consumer expenditure.
Here’s a map of countries color-coded by how much a years’ worth of food costs for one person. Click on any country for more info:
Want to compare the two? The map with the blue background (before) is of percentage of annual expenditures on food. The map with the gray background (after) is of annual cost of food per person. Use the slider to compare the two images:
© Copyright IBTimes 2026. All rights reserved.
- MOST POPULAR IN Business