

Correlation among income tax rate, tax receipts, and GDP
An analysis of the correlation among U.S. personal income tax rate, tax receipts, and the gross domestic product (GDP) reveals a high correlation between GDP and tax receipts. However, other correlations among the three data series are noticeably weaker.
To download the Microsoft Excel file of the analysis and data used, click here.
Background
There is a fierce debate in Washington over the expiration of the Bush tax cuts. If these tax cuts are allowed to cease, then personal income tax would increase in 2011. Some want all of them to expire, others want all of them extended, and those in the middle, including the Obama administration, want to extend only some tax cuts.
Proponents of keeping the tax cuts say tax hikes are anti-growth. One argument is that given the fragile state of the economic recovery, it is unwise to raise taxes. Others in this camp believe the way to reduce the ballooning U.S. debt is to foster economic growth through tax cuts. Economic growth would then result in higher tax revenues, which would in turn reduce the deficit.
Proponents of letting the income tax cuts expire – thus raising income taxes for 2011 – argue that U.S. debt is too high. To raise tax revenues, they advocate raising the income tax rate. Some in this camp point out that many of Bush's income tax cuts benefit the rich. Therefore, some advocate raising income taxes for only the top two tax brackets.
Findings From Analysis
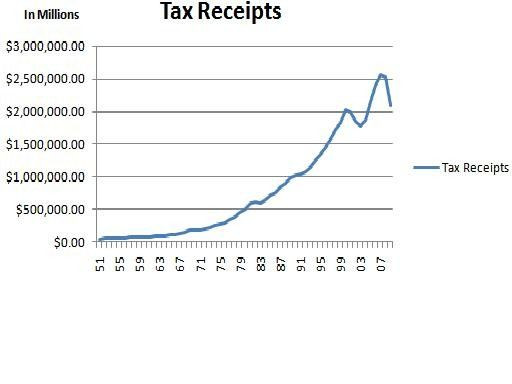
U.S. tax receipts is highly correlated to GDP growth. However, the correlation among income tax rate and tax receipts is much weaker. So the best way to raise tax revenues is probably through fostering economic growth.
However, lower taxes may not necessarily lead to GDP growth. After WWII, both the income tax rate and GDP growth edged down in the U.S., suggesting that secular trends or other policies affect GDP more than income tax rates.
To view graphs and scatter plots of correlation among U.S. Income Tax Rate, Tax Receipts and GDP, click here.
Implications
Economic structural influences and secular trends play the dominant role in both GDP and tax receipts growth. In the U.S. at least, income tax policy, which tends to be cyclical in nature, plays a lesser role in influencing the GDP and tax receipts.
Like the GDP, tax receipts have been trending up the past century. And except for interruptions like the Great Recession, it has continued to grow in recent times. Therefore, the ballooning U.S. deficit and debt in the past 10 years probably result from the expenditures side, not from the income side.
Data Sources
Figures for tax receipts come from the Office of Management and Budget. Figures for tax rates were the income tax rates for the highest tax bracket; the data is from the Tax Foundation. Figures for GDP come from the Bureau of Economic Analysis.
For comparison purposes, some figures have been shifted up or down along the vertical axis. For some comparisons, GDP growth and tax receipts appear as the percent change from the preceding period or the change of its natural log from the preceding period.
Email Hao Li at hao.li@ibtimes.com
Click here to follow the IBTIMES Global Markets page on Facebook.
Click here to read recent articles by Hao Li.
© Copyright IBTimes 2025. All rights reserved.
- MOST POPULAR IN World


