Here's Where Inflation Is Being Felt The Hardest In US
Inflation has been a painful part of lives around the world, and in the United States, many have been questioning if they will ever feel relief from sky-rocketing prices on fuel, food, housing and other essentials. However, while the pressure of inflation has certainly been felt from coast to coast, certain parts of the U.S. have been hit the hardest.
According to WalletHub, when looking at data from the Consumer Price Index (CPI), residents in the Sun Belt have been experiencing the most growth in inflation over the course of the last year, with rates closer to 10% when it comes to increases, versus a still extraordinarily high national average of 8.3% in August. Comparing metrics for both the Consumer Price Index Change in the latest month from both two months prior and one year ago, they found that specifically, the Phoenix-Mesa-Scottsdale, Ariz. area has had the worst inflation, with a 13% change from a year ago and 0.8% rise over the past two months. When scoring all the metrics, the area ranked at the top with a score of 92.11 out of 100.
The other markets with the highest scores were Atlanta-Sandy Springs-Roswell, Ga. (87.59), Tampa-St. Petersburg-Clearwater, Fla. (84.16), Miami-Fort Lauderdale-West Palm Beach, Fla. (72.84), Dallas-Fort Worth-Arlington, Texas (69.2). Riverside-San Bernardino-Ontario, Calif. (68.71), Denver-Aurora-Lakewood, Colo. (67.12), Baltimore-Columbia-Towson, Md. (66.79), Minneapolis-St. Paul-Bloomington, Minn. and Wis. (62.74) and Houston-The Woodlands-Sugar Land, Texas (61.99). While Phoenix, Miami and Baltimore were among the highest increases year-over-year, all three cities were knocked out of the top five in the last two months' measurement, being replaced by Denver, with the fastest growth of 1.7% in the last few months, San Diego and Minneapolis. Tampa and Atlanta both ranked among the highest increases during both periods.

Conversely, the cities with the least inflation growth where it hasn't been felt as hard have been San Diego, Boston, Honolulu, New York and San Francisco year over year, with increases from 5.7-7.3%. Those numbers for New York and San Francisco, as well as Los Angeles, Chicago, Detroit and Anchorage, were also encouraging over the last two months. All had negative growth in that time period, ranging from –0.10% to -4.00%.
However, those cities are also among the ones that have the highest cost of living in the U.S. on a regular basis, meaning that an increase in some prices likely wasn't as extensive.
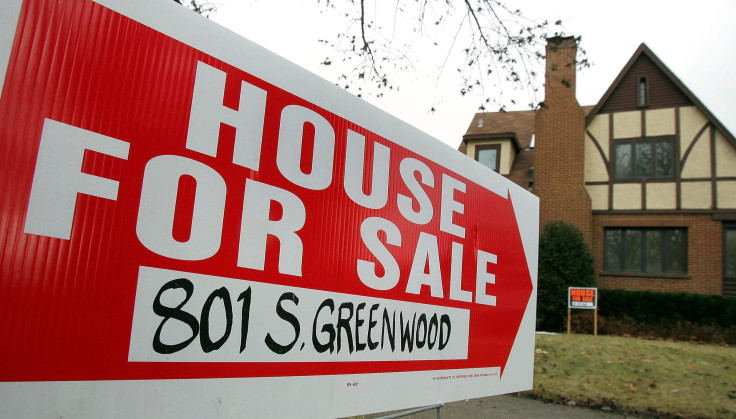
As for why these markets potentially are feeling inflation the hardest, many were also among the places that saw an influx of new residents at the onset of the pandemic, which saw people leaving larger metropolitan areas for bigger spaces in smaller cities, towns and suburbs. Data on home sales showed that Phoenix, Tampa and Boise, Idaho, were among the hottest markets at the time. They have since cooled, but many markets are still seeing enormous increases in average year-over-year housing prices, according to Redfin.

Data collected there for August showed that while some prices are declining and homes are sitting on the market longer because of interest rate hikes by The Fed, prices year-over-year are up in all markets except for Baton Rouge, La., Oakland, Calif. and San Francisco. Markets like Phoenix are still up 10.7% in that same time period, while Atlanta is up 15.6%, Tampa is up 19.7%, Miami is up 12.2% and Dallas is up 13.9%.
The other markets with the highest prices year-over-year are Cape Coral, Fla. (20.6%), Knoxville, Tenn. (20%), North Port, Fla. (19.5%) and West Palm Beach, Fla. (19.2%).
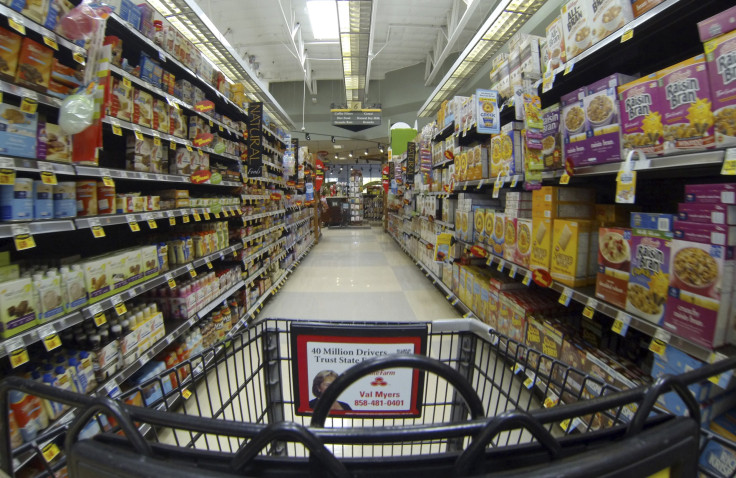
The pain of inflation is likely not to get better anytime soon, despite prices dropping on gasoline. The Food index rose 11.4% over the past year, according to CNBC, with data from the CPI still showing astronomical increases in August year-over-year.
That data has shown the sharpest increases in the price of Eggs (39.8%), Butter (24.6%), Flour and prepared flour mixes (23.3%), roasted coffee (18.7%) and frankfurters (18.3%). Increases over 15% were also seen year-over-year on Lunchmeat, fresh and frozen chicken parts, fresh milk other than whole, cereals and cereal products, white bread, sugar, rice, pasta, cornmeal, peanut butter, fruits and veggies, prepared salads and canned fruits and vegetables.

© Copyright IBTimes 2025. All rights reserved.


