

NASA Animation Shows Smoke From Australia Fires Travelling Halfway Across Earth

KEY POINTS
- NASA satellites are tracking the Australia fires
- Data shows the smoke has travelled halfway across the world by Jan. 8
- NASA expects the smoke to circle the Earth at least once
The Australian bushfires are wreaking havoc both in and out of the country. In fact, only recently, a report from the UN World Meteorological Organization revealed that the smoke from the raging bushfires has already drifted across the Pacific and reached South America, causing the skies in Chile to become gray and the sunset in Buenos Aires to become red.
PyroCbs
According to NASA, the conditions in Australia that combine factors such as searing heat with historic dryness has led to the formation of large numbers of pyrocumulonimbus (pyroCbs) events, which are basically fire-induced thunderstorms.
PyroCbs are triggered by the uplift of material such as smoke, burning material and ash that eventually form clouds that behave like thunderstorms. However, unlike traditional thunderstorm clouds, these clouds do not bring precipitation. Instead, these "firestorms" tend to worsen fires by generating strong winds, transporting the embers and striking lightings.
Because of pyroCbs, the smoke can reach the stratosphere 10 miles in altitude, allowing it to travel thousands of miles away from the source, thereby affecting global conditions. In fact, nearby New Zealand is already greatly affected by the smoke, which has caused air quality to worsen and mountaintop snow to darken.
Travelling Smoke
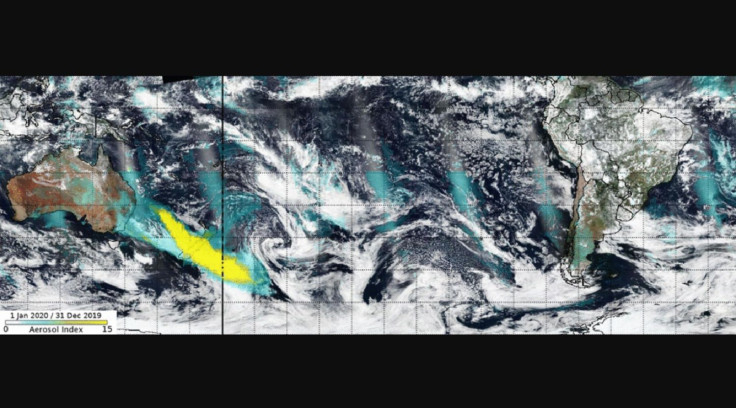
Using various instruments on NASA satellites, the agency has been tracking the movement of smoke coming from the Australian bushfires by tracking pyroCbs events. For instance, the data from the VIIRS and OMPS-NM instruments aboard NASA-NOAA’s Suomi National Polar-orbiting Partnership (NPP) satellite can be combined to track the event globally.
Because VIIRS can provide a true-color view of the smoke while data from the OMPS-NM can be used to create an ultraviolet aerosol index to track the aerosol and smoke from pyroCb events, an animation that combines information from the two can enhance the data from both instruments.
The fires in Australia are not just causing devastation locally. A fleet of @NASAEarth satellites are working together to analyze the accumulation of aerosols and smoke, which is causing an unusually large number of fire-induced thunderstorms: https://t.co/9DRkatm0mf pic.twitter.com/MDZex82NbQ
— NASA (@NASA) January 9, 2020
“The UV index has a characteristic that is particularly well suited for identifying and tracking smoke from pyroCb events: the higher the smoke plume, the larger the aerosol index value. Values over 10 are often associated with such events. The aerosol index values produced by some of the Australian pyroCb events have rivaled that largest values ever recorded,” research scientist at Goddard Colin Seftor said.
Based on the animations provided by NASA, one can see that by Jan. 8, the smoke from the bushfires had already traveled halfway around the world. According to NASA, the smoke is expected to make at least one full circle around the globe and return to Australia.
© Copyright IBTimes 2025. All rights reserved.
- MOST POPULAR IN Science


