

Satellite Data Shows Change In NYC’s Nighttime Illumination

KEY POINTS
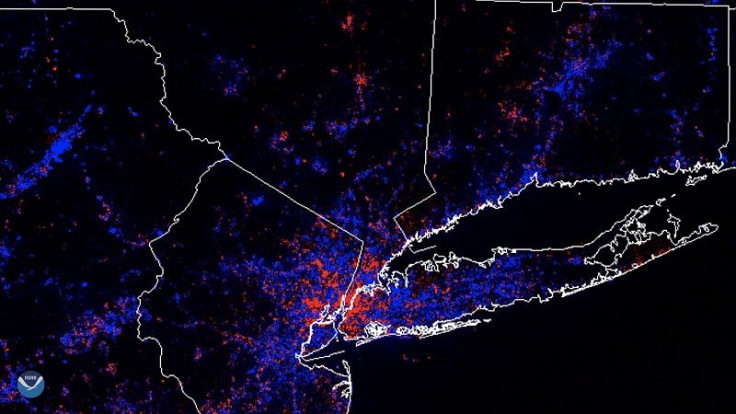
- Scientists created an image that shows the changes in New York City night illumination
- There were parts of the Metro that dimmed as well as parts that brightened
- According to the scientists, such images can help prepare for future pandemics
Scientists created an image that shows the change in nighttime illumination in New York City amid the coronavirus slowdown. Although many parts dimmed, there were places that brightened.
Using the Day/Night Band (DNB) data from the Suompi NPP satellite, scientists from various institutions studied the difference in urban and suburban illumination from the Mid-Atlantic to New England between February and March, 2020. Armed with this data, the scientists produced an image that shows parts of New York City and its surrounding regions that dimmed as well as the parts that brightened.
In the image, the red parts show the areas where nighttime illumination increased, while the blue parts show the areas where the lights dimmed.
Overall, the scientists noted a decrease in nighttime illumination in various locations such as Upstate New York, Staten Island and central Long Island. In others, including Brooklyn and Manhattan, there was an increase in illumination.
"It's tied to human behaviors, economic drivers, and vulnerabilities down to the local scale. From a practical perspective, what we learn from images like these can help inform planners on how best to ready ourselves for potential future pandemics," senior research scientist at Colorado School of Mines (CSM), Steve Miller, explained. "For example, significant light decreases can point to what businesses have closed during a pandemic, while light increases show areas of still-running critical infrastructure or show where people moved during it."
For instance, CSM scientist researcher Chris Elvidge noted the possibility the ilumination increase in Hampton shores could be a result of people moving to their summer homes earlier.
Similarly, in March, NASA Earth Observatory also released images showing the changes in nighttime illumination in Wuhan, the epicenter of the coronavirus epidemic. In the images, the drastic difference in nighttime illumination before and after the coronavirus-related restrictions were enforced can be observed.
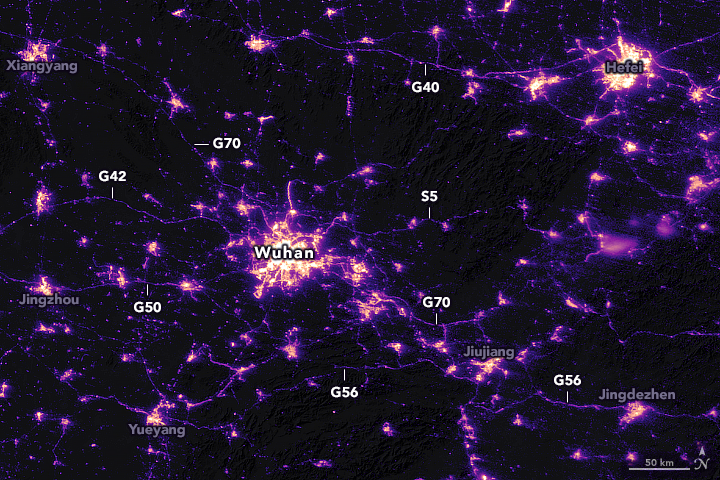
Specifically, the illumination showed a marked dimming of the highways leading to and from the city of Wuhan, reflecting the changes in human movement as a result of the pandemic.

In both cases, satellite data reflected the changes in human activity and movement in response to the coronavirus slowdown.
As for the DNB data, scientists have used it for other events wherein dimming or power outages were experienced.
"We've used it for hurricanes, earthquakes and in conflict zones," CSM scientist Chris Elvidge said. "But the worldwide COVID-19 pandemic offers scientists their first opportunity to observe the dimming of lights across entire countries and continents."
© Copyright IBTimes 2025. All rights reserved.
- MOST POPULAR IN Science


