Why September Is The Worst Month Of The Year: Stocks Tank; Banks Fail

We are coming up on the worst month for the U.S. stock market: September.
It’s not October, the month when Black Monday and Black Tuesday occurred, marking the crashes of 1987 and 1929. And it’s not May, the month that the well-known trading adage warns investors to “sell in May and go away.”
Since 1929, the S&P 500 (INDEXSP: .INX) has averaged -1.1 percent for September, making it one of only three months with negative average returns over that time, according to Scott Minerd of Guggenheim Partners.
Check the chart below.
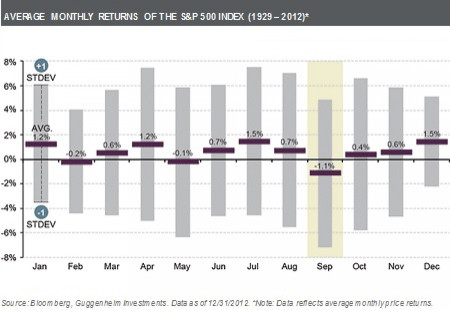
The worst-performing single month over this time period was September 1931, when the S&P composite fell 30 percent.
There are several theories that attempt to explain this phenomenon. One particular theory points to the fact that trading volumes are usually light during summer months as investors head toward the beaches. Once fall begins, these investors would return from vacation and exit positions they had been planning on selling. When this occurs, the market experiences a rise in selling pressure, and based on the law of supply and demand, there will be an overall decline in stock prices.
Another possible explanation for the market’s poor performance during September is the effect of mutual funds’ year-end “window dressing.” Many mutual funds end their fiscal year in September. And to look “smart” in front of their clients when they present the portfolio and fund performance to clients or shareholders, mutual fund managers will sell stocks with large losses.
Of course, there are also the macroeconomic uncertainties in the U.S. and around the world.
“The potential tapering of the Federal Reserve’s asset purchase program, the budget debate in Washington, and the German election could all increase volatility in global financial markets,” Minerd said.
September isn’t just a cruel month for equities. It has also witnessed the highest number of banking crises.
An IMF working paper on the frequency of banking crises showed September as a huge outlier, with 24 of the 147 worldwide calamaties since 1970 that the paper's authors took into account happening that month.
This scary chart in the report proves the point.
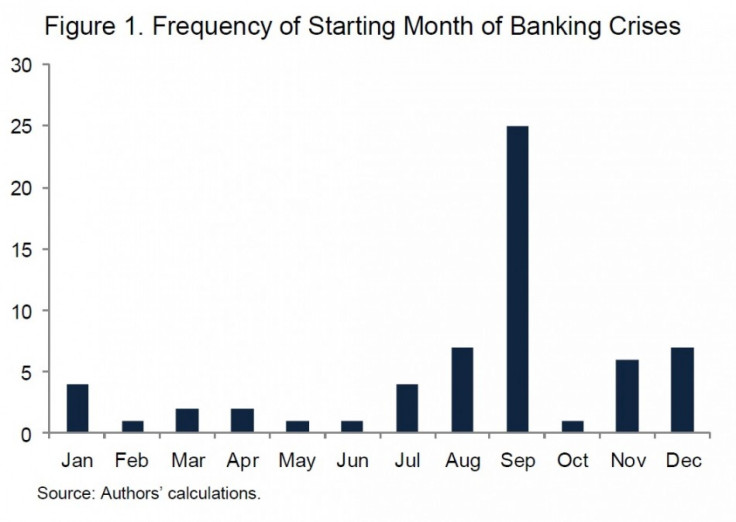
The frequency with which the world goes to dig itself into a hole in September seems hardly random, given that policymakers and bankers don't confront their problems until they get back from vacation.
© Copyright IBTimes 2026. All rights reserved.
- MOST POPULAR IN Business