Satellite Images, Machine Learning Map Poverty
“The elimination of poverty worldwide is the first of 17 UN Sustainable Development Goals for the year 2030. To track progress towards this goal, we require more frequent and more reliable data on the distribution of poverty than traditional data collection methods can provide.”
Those are the opening words on the website of Stanford University’s Sustainability and Artificial Intelligence Lab, and its researchers have come up with an unusual — and effective — way to map and predict the distribution of poverty; their method combines high-resolution satellite imagery with machine learning.
The researchers explain their methodology, which they call “cheap and scalable,” in a video.
The study, titled “Combining satellite imagery and machine learning to predict poverty,” was published in the journal Science.
Citing “very little local-level information on poverty” and “a limited number of surveys conducted in scattered villages across the African continent,” coauthor Marshall Burke, an assistant professor of Earth system science at Stanford and a fellow at the Center on Food Security and the Environment, said in a statement: “At the same time, we collect all sorts of other data in these areas — like satellite imagery — constantly.”
The study combines nighttime and daytime high-resolution satellite imagery to trace development. Areas better-lit at night are usually more developed, and daytime images show things like roads, urban settlements and farmland. The data from satellites was fed to a machine learning algorithm.
“Without being told what to look for, our machine learning algorithm learned to pick out of the imagery many things that are easily recognizable to humans,” Neal Jean, a doctoral student in computer science at Stanford's School of Engineering and lead author of the study, said.
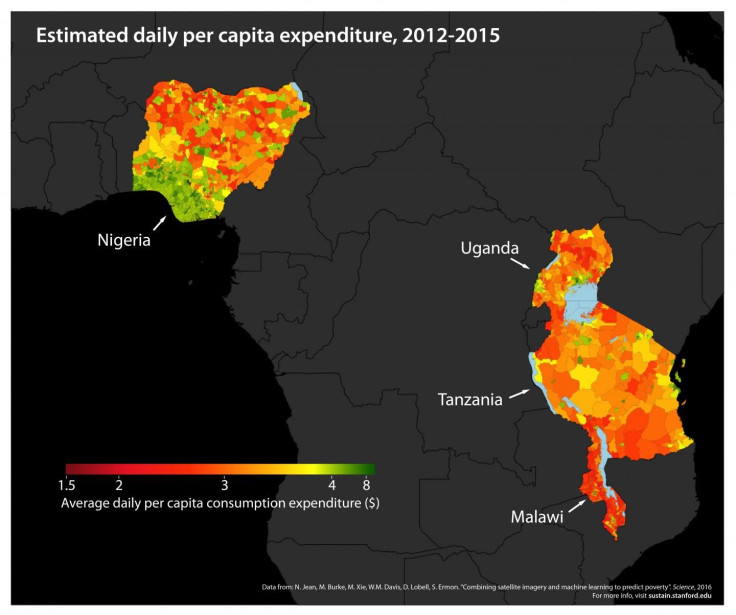
Researchers “found that this method did a surprisingly good job predicting the distribution of poverty, outperforming existing approaches. These improved poverty maps could help aid organizations and policymakers distribute funds more efficiently and enact and evaluate policies more effectively.”
© Copyright IBTimes 2026. All rights reserved.
- MOST POPULAR IN World