

Brisbane’s Housing Squeeze Ahead of the 2032 Olympics: What Investors Need to Know
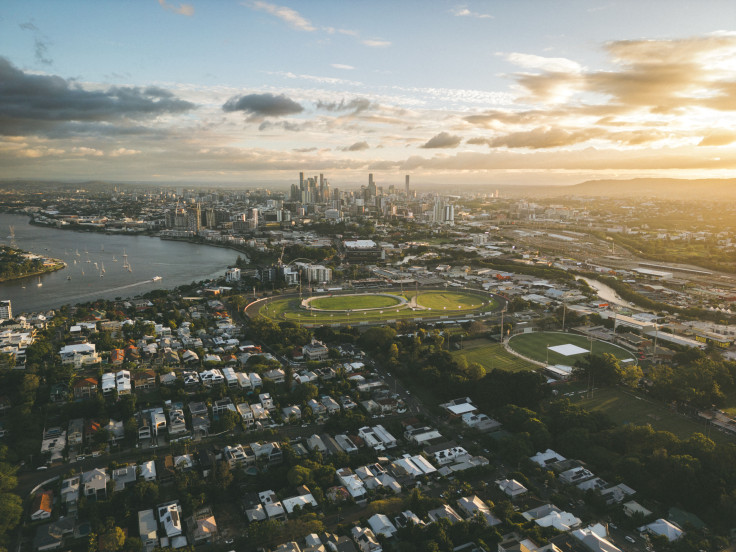
Brisbane already has one of the tightest rental markets of any Australian capital. It is now six years from hosting an Olympic Games backed by more than nineteen billion Australian dollars in combined venue and transport infrastructure spending. For property investors weighing where capital moves next, that combination is difficult to ignore, and difficult to read correctly.
A market that was already stretched before the Games were confirmed
Brisbane's rental vacancy rate has been sitting at around 0.8 percent, a level most markets would describe as a crisis rather than a data point. Average weekly rents in the city have climbed to roughly 727 Australian dollars, and that pressure predates any Olympic-related construction. It has been driven by a wave of interstate arrivals: the most recent full year of Australian Bureau of Statistics migration data shows Queensland gained 21,595 net interstate migrants, while New South Wales lost 24,328 residents over the same period, the clearest state-to-state transfer in the country.
That is the baseline. The Olympics do not create Brisbane's housing pressure. They arrive on top of it.
What is actually being spent, and where
The Australian and Queensland governments have settled on a 7.1 billion dollar Games Venue Infrastructure Program, with the federal government contributing 3.435 billion dollars of that total. The centrepiece is a new 3.7 billion dollar main stadium at Victoria Park, seating 60,000 for the Games. A new aquatic centre nearby is budgeted at 650 million dollars. Seventeen venues in total are being built or upgraded across the state.
Separate to venues, the Commonwealth has committed 12.4 billion dollars to transport infrastructure tied to the Games but designed to outlast them, new rail and road corridors intended as permanent city infrastructure rather than temporary Games logistics. An independent KPMG assessment commissioned by the Queensland government put the total economic benefit at 8.1 billion dollars for the state and 17.61 billion dollars nationally.
For an investor, the transport figure matters more than the venue figure. Stadiums are landmarks. Transport corridors are what actually move property values, because they change which suburbs are commutable and which are not.
What the last two Olympic hosts actually show
Sydney and London give two genuinely different templates, and the difference matters for how an investor should read Brisbane.
Sydney's housing market rose by around 20 percent between 1998 and 2000 in the direct run-up to the 2000 Games, concentrated in and around host suburbs during the bidding and pre-Games period specifically, not evenly across the city. The more striking number is what happened afterward: median house prices in Sydney grew a further 38.5 percent two years after the Games, and 66.4 percent within three years. The Sydney pattern was not a pre-Games spike that faded. It was a pre-Games rise that continued to compound.
London tells a more muted story in the short term. The immediate price impact of hosting was modest, commonly cited at five to ten percent and relatively short-lived. But the announcement effect, the period between London being awarded the Games in 2005 and the event itself, added an estimated 1.4 billion pounds to property values within nine miles of the eventual Olympic Park. And the long-tail numbers are the ones worth an investor's attention: a decade after the 2012 Games, in 2022, the former Olympic boroughs led London's price growth. Waltham Forest saw average prices rise from just under 242,000 pounds to just over 537,000 pounds between 2012 and 2022, a 122 percent increase. Newham and Hackney each saw prices roughly double over the same decade.
The pattern across both cities is not that Olympic hosting produces an immediate windfall. It is that the suburbs and transport corridors built or upgraded for the Games become the long-run winners, often years after the closing ceremony, once the infrastructure legacy is actually in daily use rather than newly finished.
Where that points in Brisbane
Applied to Brisbane, the transport-led read of Sydney and London suggests the areas to watch are not necessarily the suburbs immediately surrounding Victoria Park, but the corridors along the new transport investment, the parts of the city and its surrounding region that the 12.4 billion dollar transport program is designed to connect more effectively to the centre. That is a broader and more diffuse map than "buy near the stadium," and it is also a slower-moving one, closer to the multi-year London pattern than the faster Sydney one.
It is also worth noting that Brisbane's starting position differs from both precedents. Sydney and London were not already sitting at a 0.8 percent vacancy rate when their Games were awarded. Brisbane's Olympic infrastructure programme is landing on a market with essentially no existing slack, which argues for the demand-side pressure compounding the infrastructure effect rather than simply following it.
The demand side nobody prices in early enough
Games-related construction and infrastructure spending get most of the investor attention because they are the largest, most visible numbers. The population side of the story is less visible and, on the evidence of Sydney and London, arguably more durable, because it does not stop when the last venue is finished.
Queensland's population growth has been running well ahead of the national average for several years, and Brisbane absorbs the largest share of it. The state's economic growth has also been outpacing its population growth in per capita terms, a signal that the growth is not simply more people diluting existing output, but genuine economic expansion drawing people toward it. Construction alone now employs around 288,000 people in Queensland, the state's second largest employing sector, and that figure sits before the bulk of Olympic-related building has occurred.
The physical evidence of that migration shows up first in an unglamorous place: the volume of interstate relocations actually being booked. Brisbane removalists have reported a steady rise in interstate work over the past several years that tracks closely with the ABS migration figures, a leading indicator that shows up in booking data well before it appears in official statistics. It is a mundane data point next to a stadium budget, but it is arguably the more reliable one, because it reflects households that have already committed to the move rather than projected growth.
The regional angle investors tend to overlook
Brisbane absorbs the largest share of interstate arrivals, but it is not the only part of Queensland benefiting from the same underlying growth story, and a Brisbane-only view understates how broad the current cycle actually is. Far North Queensland has been drawing a different, increasingly diverse cohort: mining and resources workers using Cairns as a base for fly-in fly-out rotations into the Bowen Basin and surrounding mine sites, retirees drawn by the climate and lower entry prices relative to the southeast corner, and a growing share of arrivals in the thirty-to-forty-nine age bracket, a demographic that brings jobs, schooling demand and long-term housing commitment rather than a purely seasonal presence.
For an investor priced out of Brisbane's compressed yields, that regional spread matters. Far North Queensland property carries a meaningfully lower entry cost than the southeast corner while sitting inside the same state-level growth and migration story driving Brisbane's numbers. It will not see anything like the direct Olympic infrastructure spend Brisbane is receiving, but it benefits from the same net population inflow, and price growth in a market starting from a much lower base can outpace a compressed capital city on percentage terms even without a single dollar of Games-related construction landing locally.
This is also where the demand-side evidence is most visible in practice. Cairns removalists report the same pattern seen in Brisbane, a steady climb in interstate bookings that maps onto the wider state migration data well ahead of any official release, and a customer base that has shifted from being almost entirely retirees a decade ago to a genuine mix of working-age arrivals today.
The risk side investors should not skip
None of this argues that an Olympic host city is a guaranteed uplift. London's own experience shows the short-term impact can be modest and the gains genuinely long-tail rather than immediate, which is a poor fit for an investor working to a five-year horizon rather than a fifteen-year one. Host cities have also, in other Games cycles globally, seen construction-driven oversupply in specific precincts once venue-adjacent development overshoots actual long-term demand, a risk concentrated in the areas closest to venues themselves rather than the wider transport-corridor suburbs.
The more defensible read of the data, across both Sydney and London, is that broad transport-corridor exposure has outperformed narrow venue-adjacent bets, and that the gains have arrived on a longer timeline than most pre-Games commentary assumes.
What this means for the years immediately ahead
Brisbane's housing squeeze is not an Olympics story primarily, it is an interstate migration story that the Olympics investment is now compounding rather than causing. For anyone actually planning a move into the state over the next few years, whether for investment purposes or otherwise, the relocation activity itself has become as much a data point on regional demand as a logistical necessity. Operators such as R2G Transport & Storage, working across both the southeast and Far North Queensland corridors, have a genuinely useful vantage point on where that demand is actually landing, months before it shows up in official rental or migration statistics.
For investors, the honest takeaway from Sydney and London is patience matched to the right geography: the transport corridors being built now are the multi-year story, not the venues themselves, and the biggest gains in both historical precedents arrived well after most observers had stopped watching.
© Copyright IBTimes 2026. All rights reserved.