

The Largest Digital Survey Of The Visible Universe Is Now Publicly Available

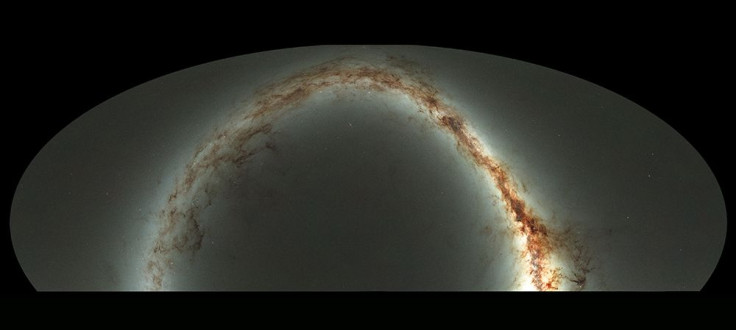
Over the past four years, astronomers associated with the Panoramic Survey Telescope and Rapid Response System (Pan-STARRS) project at the University of Hawaii at Mānoa have repeatedly scanned three-quarters of the sky in visible and infrared light. Now, these images, which show up to 3 billion stars, galaxies and other celestial objects, are freely available for download — if you have 2 petabytes of spare space, that is.
“The Pan-STARRS1 Surveys allow anyone to access millions of images and use the database and catalogs containing precision measurements of billions of stars and galaxies,” Ken Chambers, director of the Pan-STARRS Observatories, said in a statement released Monday. “Pan-STARRS has made discoveries from Near Earth Objects and Kuiper Belt Objects in the Solar System to lonely planets between the stars; it has mapped the dust in three dimensions in our galaxy and found new streams of stars; and it has found new kinds of exploding stars and distant quasars in the early universe.”
The images were captured using the 1.8-meter telescope on the summit of Haleakalā, on Maui, Hawaii. In addition to expanding the census of almost all objects in our neighborhood to distances of roughly 300 light-years, the images would also help scientists understand the formation of low-mass stars in stellar clusters.
“Achieving the high quality of the Pan-STARRS1 measurements and maintaining it over such an enormous quantity of data was a unique computational challenge and the results are a tribute to the dedicated efforts of our small team of scientists at the UH IfA [University of Hawaii Institute for Astronomy] and our collaborators who worked to process and calibrate the extraordinary volume of raw image data,” Eugene Magnier, lead of the Pan-STARRS image processing team, said in the statement.
The data from the survey, which is available for download here, is being released in two separate tranches. The first portion, released Monday, provides the average value for the position, brightness and color for the objects imaged, while the second dataset, to be released next year, will include catalogs and images from each of the snapshots that Pan-STARRS took of a given region of sky.
© Copyright IBTimes 2025. All rights reserved.
- MOST POPULAR IN World


