Taking The Stock Market To Higher Dimensions: Researcher Envisions A Geometrical Jewel At The Heart Of Finance
How do you picture the stock market: a bunch of guys yelling at computer screens on Wall Street? A long list of figures in the paper? Or, perhaps, an ever-shifting, higher dimensional jewel?
The latter vision is that of Ovidiu Racorean, a Romania-based researcher for a hedge fund. He has an idea for how to encode the behavior of the stock market into an object that he calls the stock market polytope, or the “stockmarkethedron”.
It “is not easy to imagine the stock market as a geometric shape,” Racorean writes in a paper published on the pre-press database arXiv (the work has not yet appeared in a peer-reviewed journal, though Racorean has submitted it to several). “Still the stock market polytope fully encodes all the relevant information about the current … state of the stock market.”
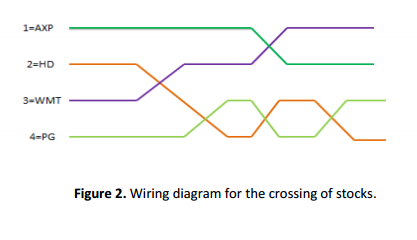
So just how do you start transforming stock prices into a complex object? The key to Racorean’s method, he explains, is stock price crossings.
“All the stocks that compose the market are crossing each other -- every time a stock gets higher or under the price of another stock, [that makes] a crossing,” Racorean said in an interview. “And every cross in the market will add a new face on the geometrical shape.”
All those faces upon faces can be added up to form a kind of object called a “positive Grassmannian” – the same class of object that includes the amplituhedron, a higher-dimensional jewel recently described by theoretical physicists that encodes the probabilities of interactions between subatomic particles.
“The positive Grassmannian is the slightly more grown-up cousin of the inside of a triangle,” Princeton University physicist Nima Arkani-Hamed, the lead researcher on the team that described the amplituhedron, told Quanta Magazine last September.
The “inside” of a triangle is a two-dimensional shape, fenced in by lines. The positive Grassmannian is an N-dimensional space (N is a variable, so it can be any number of numbers, depending on the situation), fenced in by intersecting planes, Arkani-Hamed explained to Quanta.
As the amplituhedron is derived from the probabilities of particle interactions, the stockmarkethedron is shaped by “the probability of some stocks to cross each other, to have some kind of shape,” Racorean says. “As the investor computes this volume, they will know with some probability how the market will go.”
So, one can see a stockmarkethedron performing like a financial crystal ball: a view of the present with some glimmer of likely futures in its facets.
Whatever shape the stock market might take, it would be something that would be constantly morphing as share prices move up and down, crossing and recrossing. A volatile day would have more crosses, so more facets; a more placid day would have fewer.
One of Racorean’s next projects is to take his computation of the stockmarkethedron back in time. He wants to look at specific points in stock market history – namely, the time right before the start of the global financial crisis in 2007-2008.
“I just want to see how the market looks like when the crisis is near,” Racorean says.
Wouldn’t we all?
SOURCE: Racorean, Ovidiu. “Crossing Stocks and the Positive Grassmannian I: The Geometry behind Stock Market.” arXiv: 1402.1281, February 2014.
© Copyright IBTimes 2026. All rights reserved.
- MOST POPULAR IN Business