Statistics in commodity markets and especially silver off the charts
Silver Prices just made a 3.5 standard deviation move...
SO WHAT ARE the odds? Things that just shouldn't happen simply keep happening, writes Adrian Ash, head of research at BullionVault.
- In July 2008, US crude oil prices made the kind of year-on-year jump that its statistical standard deviation says should happen every six decades or so - only to make another such jump in April 2011;
- By the standard deviation of the previous three decades, iron ore prices made a one-in-775-billion jump in spring 2010;
- Cotton futures went crazier still in the seven months to Feb. 2011, as Sean Corrigan of Diapason Commodities noted, making a nearly 10-sigma move (ie, 10 times its standard deviation). That's a 1.523970*10^-23 shot.
Perhaps something was changing in the asset world to have caused so many outliers in the last 35 years, asks GMO asset management's Jeremy Grantham in his new letter to clients.
Reviewing everything from the stock-market crash of 1974 to US housing's first-ever nationwide bubble thirty years later, my [investing] career...has been filled with an unusual number of real outliers, Grantham concludes.
But perhaps, in a world cut free from all limits on the quantity of money, what used to look like unlikely, far-fetched outliers are becoming par for the course. Or perhaps the maths is just wonky.
We were seeing things that were 25-standard deviation moves, several days in a row, claimed Goldman Sachs' chief financial officer David Viniar in August 2007. Yes, he was talking about losses, not bubbling gains. But he was also talking through his hat, at best.
The probability of a 25-sigma event is comparable to the probability of winning the lottery 21 or 22 times in a row, found a paper for the Journal of Portfolio Management published the next spring. And events deemed that unlikely by your model either will not happen, or your model is junk.
Take silver (if you can get it) for instance. Silver Prices showed an annual gain of 175% at late-April's peak. (Dark forces, you see, are working to suppress silver.) That compares with an average year-on-year change, going back to Jan. 1969, of +11.9%. Divide the difference between those two numbers by the standard deviation in silver's year-on-year rate of change (don't glaze over, we're almost there) and you get what brown-corduroy beards on the BBC's Open University would call the Z-score - in late-April's case, a reading of 3.46.
The Z-score is counted in standard deviations - aka sigma - and anything above 2.0 sigma, according to people who make a living from such stuff, means you're looking at an outlier...a bubble perhaps. Because that kind of Z-score, at two standard deviations or more, marks the peak of Japan's 1989 equity bubble, the 1999 US tech-stock bubble, and the 2006 US housing bubble. (See the World Gold Council's excellent Bull Market in Perspective for more.)
A reading above 2.0 also shows up at silver's previous flirtation with $50 per ounce - squeezed into Bunker Hunt's corner of Jan. 1980 - plus six other brief periods of the last four decades, two of which peeped into the last 9 years' bull market, and one of which struck hard at the end of last month.
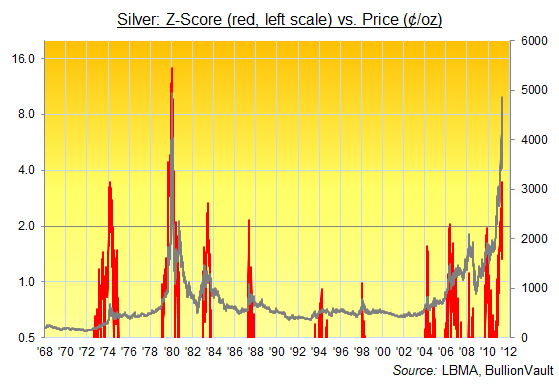
Note that the left axis, measuring the Z-score of the Silver Price's year-on-year price change, doesn't bother with low or negative readings, because we're only looking for bubbles.
Note also that it's shown on a log scale. Because when silver jumps, it really moves - so the Z-score doubles between each number on the axis.
Now, if the world mapped the nice, neat bell curve which statistical analysis calls standard distribution, then a Z-Score of 2.0-plus would account for fewer than 1-in-20 of all prices moves. For silver, however, a reading of 2.0 or more shows on fewer than 1-in-38 of all trading days since Jan. 1969. April's peak of 3.46 was rarer than 1-in-a-hundred. And to date, all such outlier moves have all ended badly in silver.
The average 1-year return for anyone Buying Silver at a Z-score of 2.0 or more has been - wait for it - minus 18.3%. Just saying. And just so you know, that compares with an average gain on gold, if bought at a bubble-top Z-score of 2.0 or more, of over 11%.

Five times in the last 42 years, the Gold Price in Dollars has risen so fast that its year-on-year gain has exceeded two or more times the standard deviation of all those daily year-on-year changes. Only two of those bubble outliers then blew up, however, and two of them (1975-6 and then May 2006) marked a mere hiatus before gold prices rose once again (8-fold and near-tripling respectively).
On a daily basis, breaching the 2-sigma level is less of a rarity for gold than silver - barely rarer than normal distribution would imply, in fact, with a near 1-in-20 frequency across all trading days in the last 42 years. And like we just saw, the curse of two sigmas has so far rewarded new gold buyers with 11% gains one year later on average - a post-bubble return that must taste like powdered unicorn's horn to Nikkei stockholders, tech-stock traders and Florida flippers.
Still, what's all this historical, statistical rubbish worth if you're out 25% in silver or 5% in gold today? Less than a $50 call on June silver, perhaps. But bubbles are about speed, not longevity. And in the 21st century so far, the prices of gold and silver have enjoyed plenty of both. GMO's Jeremy Grantham asks what changed to encourage ever-more financial outliers since the early '70s. The final end of the global gold standard looks a guilty-enough suspect, yet central banks have gone further still in the last 10 years, cutting the rate of interest to zero - and creating new queasy money explicitly aimed at reflating equity and housing bubbles.
Alarmingly frequent bubbles and busts in copper, wheat, crude oil, silver and pretty much all other natural resources might now be the collateral damage.
Buying Gold or physical Silver Bullion today...?
© Copyright IBTimes 2025. All rights reserved.
- MOST POPULAR IN Analysis