

What Greenland Would Look Like Without Ice: Video Reveals Outcome
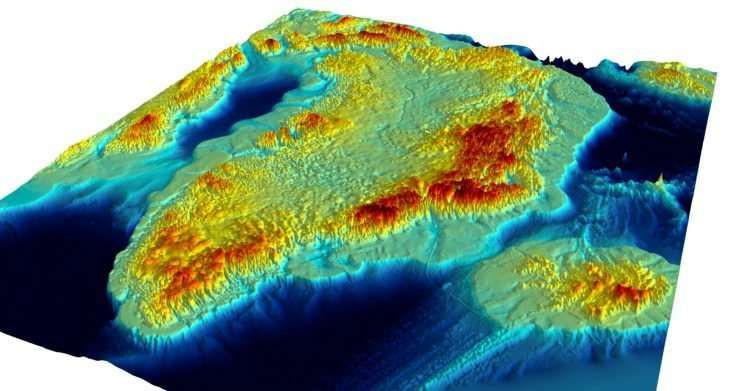
A new map detailing the topography of Greenland and what lies beneath the ice sheet was released this week as a video by the British Antarctic Survey (BAS), the University of Bristol and the University of California at Irvine (UCI).
The video/animation published this week on YouTube provides scientists with an in-depth simulation of a scenario where there is no ice on Greenland. The video gives a high resolution and accurate picture of the bedrock and coastal seafloor. It reveals how the glaciers that drain from the Greenland Ice Sheet during the possible melting will contribute to future sea-level rise.
The printed map was unveiled this week at the American Geophysical Union meeting in New Orleans and is a 1:3,500,000 scale map created from data collected by over 30 institutions using different instruments. The video used data from satellites, airborne and ground-based radar and seabed mapping from research ships.
"This new compilation of the 3-D landscape beneath the Greenland Ice Sheet provides the first seamless transition between the landmass and its adjoining seabed, and this gives scientists a bird's eye view of the fringes of Greenland which are experiencing the most changes," said BAS cartographer Peter Fretwell, who was involved in producing the printed map.
"What's also surprising is that there is more ice and the bed is deeper in some places than previous maps suggest, so this means the total contribution from the ice sheet to global sea level rise would be 7.42 meters if it were to melt completely, slightly higher than previously calculated," he added.
The video shows the data visualized in a way that makes the impact of the change evident. The team hopes that the video will prove that there could be devastating effects on coastlines across the world.
Scientists working on this project published a summary of their findings in a paper in the Geophysical Research Letters.
The land below the thick layer of ice show streams that sit on top of valley systems that were left there by flowing water from a river system before the ice sheet even existed. These valleys create a perfect run-off point for melt-water today.
This finding indicates that the ice is definitely melting and funneling water into the warming ocean that surrounds Greenland. These valley systems provide lubrication to the flow and have the potential to create more channels in the future that would only speed up the run-off.
"It reveals that many glaciers that drain the Greenland ice sheet are thicker than previously estimated — up to 100 meters in places — it also shows they have complex fjord geometries that will control how they react to changes from the effects of warmer ocean currents. This map will improve our understanding of the ice-ocean interactions and how the ice sheet will evolve in a changing climate," said glaciologist professor Jonathan Bamber at the University of Bristol who had a NERC-funded project to develop the printed map and data set.
Recent reportsindicated that the rising sea temperatures were putting Antarctic ice shelves at risk too.
The East Antarctic Ice Sheet, was considered a very unaffected-by-climate-change ice mass but the reports shows that it is not be as stable as it looks. Portions of the huge block of ice are very susceptible to our warming oceans and atmosphere which could in turn raise sea levels across the globe by 53 meters. This would spell disaster to most coastal cities that would certainly go underwater if that were to happen.
Even previously stable ice sheets are showing signs of weakness. The effects of global warming are eveident and the team hopes that immediare steps will be taken t collect more data and get more comprehensive results to better undersatnd the cause and try and stop it.
© Copyright IBTimes 2025. All rights reserved.
- MOST POPULAR IN World


