

Arctic Sea Ice Sets Disturbing New Record, Falls To Lowest Winter Level

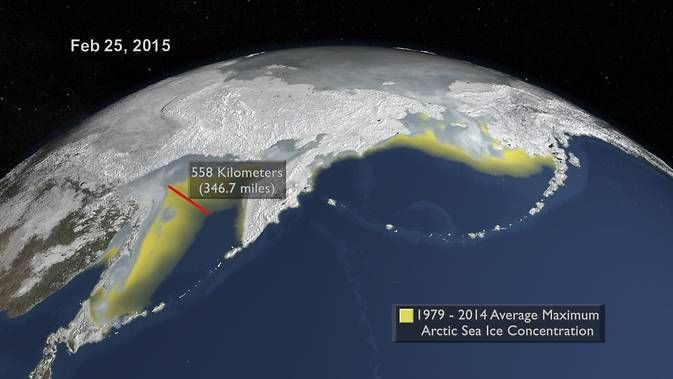
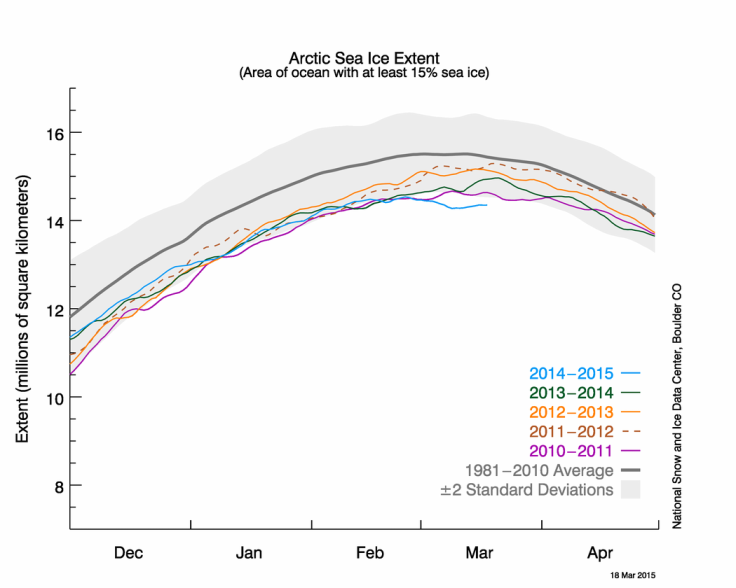
On Feb. 25, the ice cover in the Arctic reached its annual peak -- two weeks before its average date of March 12. On this particular day, the ice at the North Pole covered an area of 5.61 million square miles, which, according to the National Snow and Ice Data Center (NSIDC) at the University of Colorado, Boulder, is the lowest annual maximum ever recorded.
The annual maximum this year is a staggering 425,000 square miles less than the 1981-2010 average and over 50,000 square miles below the previous lowest maximum, seen in 2011. This also makes the latest reading the lowest winter maximum on satellite records, which extend back to 1979.
“This is not a record to be proud of. Low sea ice can create a series of reactions that further threaten the Arctic and the rest of the globe,” Alexander Shestakov, director of the Global Arctic Program at the World Wide Fund For Nature (WWF), said, in a statement.
Scientists studying the phenomenon believe that extremely warm temperatures over the Pacific and Arctic regions led to the record-low ice cover. Moreover, the melting process creates a self-sustaining cycle -- high temperatures melt ice, creating open areas of ocean that absorb more heat, which in turn melt more ice and warm up the planet.
Even in the natural course of events, the amount of the polar ocean covered by sea ice waxes and wanes with the seasons, reaching its lowest point at the end of summer and its peak at the end of winter. However, this trend has been disrupted by the presence of anthropogenic greenhouse gases in the atmosphere, causing wide swings in the ice cover at the North Pole.
According to the NSIDC, Arctic sea ice extent has declined by 4.52 percent per decade, on average. The summer minimum has seen an even steeper drop of 13.7 percent per decade.
However, neither the winter maximum nor its timing necessarily reflect what the summer minimum would be. And, it is the summer minimum that provides a true measure of the extent of permanent ice cover in the Arctic, which, in turn, indicates the speed of rise in global temperatures.
“Scientifically, the yearly maximum extent is not as interesting as the minimum. It is highly influenced by weather and we’re looking at the loss of thin, seasonal ice that is going to melt anyway in the summer and won’t become part of the permanent ice cover,” Walt Meier, a sea-ice scientist at NASA’s Goddard Space Flight Center in Greenbelt, Maryland, said, in a statement.
However, given that the latest finding comes on the back of recent research, which shows that Arctic Sea ice has thinned by 65 percent since 1975, it points to a worrying trend.
© Copyright IBTimes 2026. All rights reserved.
- MOST POPULAR IN Science


