

Biodiversity Loss: Global ‘Threat Maps’ Reveal Impact Of Human Consumption On Wildlife


Earth is currently in the midst of a very serious biodiversity crisis. Although estimates of the exact number vary widely, scientists now believe that the rapid loss in species we are seeing today is anywhere between 1,000 and 10,000 times higher than the extinction rate when humans weren’t around.
So what is the main driver of this ongoing natural disaster? An unsustainable consumption of natural resources that is also leading to a rapid habitat loss for species that are no longer perceived to serve human needs. A widely known example is the destruction of rainforests and wildlife in Indonesia and Malaysia to clear land for cultivation of palm oil — a substance used in a variety of products, ranging from biscuits and ice creams to lipsticks and detergents.
“One important challenge in conservation is that, in many hotspots, export industries continue to drive overexploitation,” Daniel Moran from the Norwegian University of Science and Technology and Keiichiro Kanemoto from Shinshu University in Japan write in a new study published Wednesday in the journal Nature Ecology and Evolution. “Conservation measures must consider not just the point of impact, but also the consumer demand that ultimately drives resource use.”
In order to do this, Moran and Kanemoto have now developed a technique that allows them to identify threats to wildlife caused by the global supply chains that fuel our consumption. Using this technique, they were able to create a series of “threat maps” that show, in explicit detail, the impact exports to the U.S., China, Japan and the European Union are having on over 6,800 vulnerable, endangered or critically endangered species around the world.
However, the maps do not cover the impact of illegal wildlife trade on global biodiversity.
“Connecting observations of environmental problems to economic activity, that is the innovation here,” Moran said in a statement. “Once you connect the environmental impact to a supply chain, then many people along the supply chain, not only producers, can participate in cleaning up that supply chain.”
In the case of the U.S., for instance, the map revealed — unsurprisingly — that consumption was creating “threat hotspots” in Southeast Asia, especially Malaysia and Cambodia, and throughout Central America, Central Asia and into southern Canada. Unexpectedly, though, the map also revealed that U.S. consumption was affecting species in southern Spain and Portugal, where a number of fish and bird species were under threat.
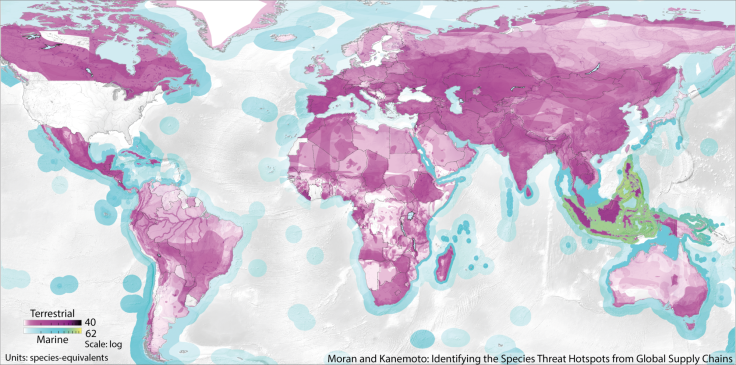
“We find that the biodiversity footprint is concentrated: for threats driven by US consumption, the 5 percent of land area that is most intensively affected covers 23.6 percent of its total impact on species, and at sea the most intensively affected 5 percent of marine area includes 60.7 percent of threatened species habitats,” the researchers wrote in the study.
The authors of the study said that the maps, which make a direct connection between consumption and environmental impacts, provide governments, companies and individuals an opportunity to take mitigative measures to prevent further biodiversity loss.
“We identified biodiversity threat hotspots that are predominantly driven by just a small number of countries,” Kanemoto told Agence France-Presse. “This should make it easier to initiate direct collaborations between producers and consumers.”
© Copyright IBTimes 2025. All rights reserved.
- MOST POPULAR IN World


