

US Shale Oil Boom: When It Comes To CO2 Emissions, Not All Crude Oil Is Created Equal
Oil is a well-known foe of the climate: Burning it to power cars or produce electricity creates harmful emissions of greenhouse gases. But each type of crude oil, it turns out, results in a unique carbon footprint, with some causing far more climate damage than others.
Now U.S. researchers have created an important yardstick that could change the way oil is sold, produced and regulated. By calculating the carbon costs of various kinds of crude and related petroleum products, they say companies and policymakers can make better decisions about which types of projects to pursue -- especially if governments put a price on carbon dioxide emissions. Under such a scenario, oils with the highest emissions levels would be penalized the most, which would ultimately make crude more expensive to produce.
“There’s a business risk associated with carbon emissions,” Jonathan Koomey, a Stanford University research fellow, said at a Wednesday panel hosted by the Carnegie Endowment for International Peace. The Washington, D.C., think tank teamed with Stanford and the University of Calgary in Canada to create the Oil-Climate Index project, unveiled at the morning conference.
“Having the kind of information that we’ve generated here … will allow investors and other actors in the industry to take proactive steps and say, ‘Look, the greenhouse gas emissions from our fields are much better than those of our competitors,’” Koomey said. “That's an example of where you could see differentiation among major players who want to gain an advantage [in a low-carbon future].”
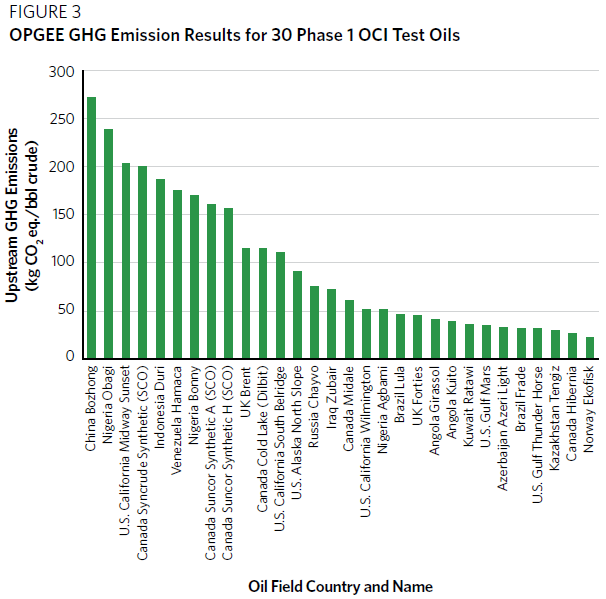
Researchers say the index is increasingly needed as the world shifts away from easy-to-access, lighter so-called conventional oil and moves toward harder-to-reach and heavier unconventional crudes -- a group that includes oil from U.S. shale formations, the Canadian oil sands patch and offshore Arctic reserves. In comparing oils from across the globe, the index revealed a more than 80 percent difference between the lowest- and highest-emitting crudes.
“You realize very quickly that there’s a lot of differences that … are all hidden under one term called oil,” Deborah Gordon, who directs the Carnegie Endowment's energy and climate program, said by phone. “I don’t think that’s going to be adequate for investors in the 21st century, or for governments permitting projects, or for the environmental community.”
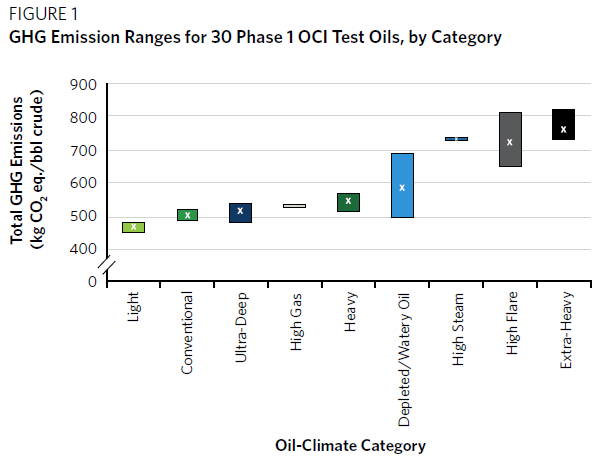
For the initial phase of the Oil-Climate Index, the team examined 30 different crudes and studied their full lifecycle emissions, which count greenhouse gases from the exploration, extraction, processing, refining, transport and consumption of the oil.
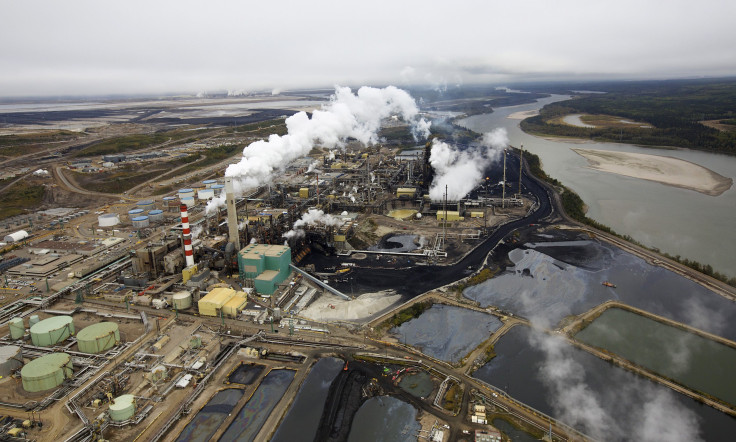
The dirtiest oil in the index, Suncor Energy’s Synthetic H blend, requires extensive amounts of energy to extract out of the Canadian oil sands. The tar-like crude must then be processed before it’s suitable for refining, another energy-intensive process. On the other end of the index is Norway’s Ekofisk oil, a much lighter type of crude. Norway’s government tightly regulates oil production, and companies in turn have reduced excessive emissions during production and refining, which lowers the overall lifecycle emissions of Norwegian oils.
An interactive Web tool, to be launched later this spring, will allow the public to play around with different scenarios. For instance, how does the carbon footprint of oil change when it’s produced in an energy-efficient refinery, versus an older energy-guzzling facility? If an oil sands producer uses solar panels to power operations, how does that affect the total emissions count?
Gordon, who started her career at Chevron, said she first conceived the idea of a global Oil-Climate Index in early 2012. Oil prices were high at the time, above $100 a barrel, which was driving energy companies to invest in expensive unconventional oil projects, including shale formations in North Dakota and Texas and offshore fields near Brazil and China.
“I knew a paradigm shift in the oil sector was going to come,” Gordon recalled. She wanted to know, “What do all these diversifying oils mean for the climate, and how do they stack up against each other?”
Similar projects were already in the works. Adam Brandt, an assistant professor at Stanford, had helped develop a tool to calculate the upstream emissions of oils used in California refineries. The state government uses those numbers to help enforce its Low-Carbon Fuel Standard, a three-year-old law that requires fuel refiners and distributors to lower the carbon-intensity of their supplies by 10 percent by 2020.
But the Stanford model doesn’t tease out the differences in emissions between midstream refineries and final consumption; it assumes a fixed number for those categories. So Brandt helped create an all-encompassing version for the Oil-Climate Index, along with Gordon, Koomey and Joule Bergerson, an assistant professor in the University of Calgary’s chemical and petroleum engineering department.
Among the first 30 different oils in the index, the team identified four particularly challenging types of crude. The first group includes gassy oils, such as those found in U.S. shale formations or in Nigeria. When crude is produced, natural gas also rises up, and many companies have found it easier and cheaper to simply burn off, or flare, the excess gas, rather than capture or store it. All that burned gas creates methane emissions, which in turn boost the crude’s overall lifecycle emissions. “Oils that resort to these practices can result in at least 75 percent largest GHG [greenhouse gas] footprints than comparable light oils that do not flare,” according to Wednesday report about the index.
In the second category are heavy oils, which are found in the Canadian oil sands and in California, Venezuela and Saudi Arabia, among other places. These crudes are highly viscous and can’t flow easily to the surface, requiring producers to use heat, steam or hydrogen to tease the oil out of the ground and make it thin enough to flow through pipelines. “The heaviest oils have total GHG footprints that can be nearly twice as large as lighter oils,” the report said.
Watery and depleted oils are third in line. These include fields where all the easily accessible oil has long since been tapped, and where copious amounts of water tend to rise along with the oil. In California’s San Joaquin Valley, for instance, up to 50 barrels of water come up with each barrel of oil. According to the index report, oils with high water-to-oil rations can have total emissions footprints that are more than 60 percent higher than oils with lower water loads.
The fourth bucket includes so-called extreme oils, like those found in offshore Arctic reserves or deep underground in Russia’s Sakhalin shelf. Others are found in areas with permafrost, boreal peat bogs and rainforests -- all of which store carbon dioxide, and will release emissions if destroyed. Oils that are difficult to access or are located in climate-sensitive environments may have significantly larger emissions footprints, researchers found.
Gordon said the Oil-Climate Index could soon be expanded to include about 50 types of crude oil, up from the current 30. But even that would represent just a handful of the thousands of oils that exist throughout the world. She said gathering data for the index has proved particularly challenging, since much of that information is closely held by private companies.
“The biggest surprise for us [in launching the index] was the lack of transparency in oil data,” she said. “The data is inconsistent, it’s lacking in many places, and in some cases it’s not for sale.” Despite two years of attempts, the team was not able to secure any information on U.S. oil from the Bakken and Eagle Shale formations -- the hottest spots in America’s unconventional oil boom.
Gordon said such data is not just critical to analyses like the Oil-Climate Index but also for policymakers and communities making decisions about pipelines and oil infrastructure. Oil companies in many cases aren’t required to inform the public about what kinds of oil are flowing through their pipelines or traveling in rail tanker cars. “The need for oil data transparency is huge,” she said. “As oil changes, we need to know more about them to handle them safely.”
Koomey said on the panel that he hopes the index will start a conversation among policymakers and industry officials about the future nature of the world's crude oil. “If you take away only one thing, it's that the [emissions] variations in oils are large enough to matter.”
© Copyright IBTimes 2025. All rights reserved.
- MOST POPULAR IN Business


