Bitcoin Golden Cross Vs. Death Cross: Which One Is Happening Next?
KEY POINTS
- Golden Cross occurs when a shorter MA breaks above a longer MA
- Death Cross occurs when a shorter MA breaks below a longer MA
- BTC's Golden Cross occured in mid-September while Death Cross came in late June
Bitcoin is not a traditional asset but to any market, traditional strategies do apply. Putting the volatility aside, Bitcoin has seen its fair share of indicators and fakeout scenarios.
Among the most feared and most appreciated scenarios in the entire crypto market are the 'death cross' and the 'golden cross,' respectively. These scenarios are drawn on the trading chart with the help of a short moving average and a large moving average.
Moving averages are =simple technical indicators, which show the average price of the security over a particular time period. The most popular ones are the 50-day Moving Average, 100-day Moving Average and 20-day Moving Average.
These averages represent the trend that a particular security is forming and are very important in the world of technical analysis. The averages filter out the "noise" in the price action so as to smoothen out the details for an analyst.
Death Cross
The death cross occurs when the the 50-day Moving Average takes a downturn and falls below the 200-day Moving Average. However, one should also note that the death cross is mostly followed by a bearish downwards trajectory but, in the case of Bitcoin whose volatility is extremely high, the case might not be always true.
BTC is known for surprising people with sudden movements and a death cross might help you save your investment. If you see the 50-day MA drop below the 200-day MA, it might be a good time to sell half of your crypto portfolio, keeping the other half, in case BTC reverses quickly and shoots up.
Golden Cross
A golden cross occurs when the 50-day Moving Average breaks above the 200-day Moving Average, signifying that it's time to buy and shine. This is a very bullish indication and a good entry point for traders who can buy the security at low prices and sell higher.
Just like the death cross is a strong bearish indicator, the golden cross is a strong bullish indicator, which suggests that a prolonged bullish period will follow. However, like in the case of the death cross, the indication given by the golden cross is not absolute.
Importance of these indicators
In the stock market, these two indicators are very important. However, in the crypto market, which never sleeps, these indicators may or may not always be viable aids in making investment decisions and might result in fakeouts. A fakeout is a situation wherein a trader takes a position following an indication of an uptrend but what follows is a downtrend instead.
If you witness the 50-day MA crossing above the 200-day MA, first compare shorter period MAs like 10-day MA to 50-day and 100-day MAs. You might see that the 10-day MA is pointing toward a death cross while the 50-day and 100-day are showing something else. This analysis can help prevent fakeouts in the crypto market where volatility is extremely high.
Death cross and golden cross this year
This year was very interesting for Bitcoin as a number of events occured in a comparatively short time frame. The word's biggest cryptocurrency experienced a death cross around June 19, when the biggest Grayscale unlocking took place.
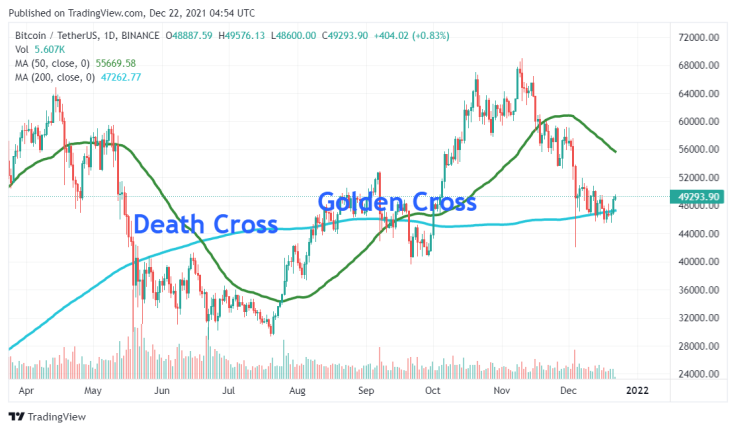
The event led to a huge sell-off for Bitcoin, which went from nearly $34,000 to a price level of $28,500. This event is clear in the chart below. On the other hand, traders witnessed a golden cross somewhere around mid-September, which was a huge bullish signal for Bitcoin.
The chart below uses the 50-day and 200-day Moving Averages to show the death cross and golden cross on the Bitcoin price chart.
The chart below takes the 20-day Moving Average and 200-day Moving Average to account to represent the formation of the death and golden crosses. It can be seen that the death cross and golden cross that occurred this year were not fakeouts as the shorter MA also confirms the same.
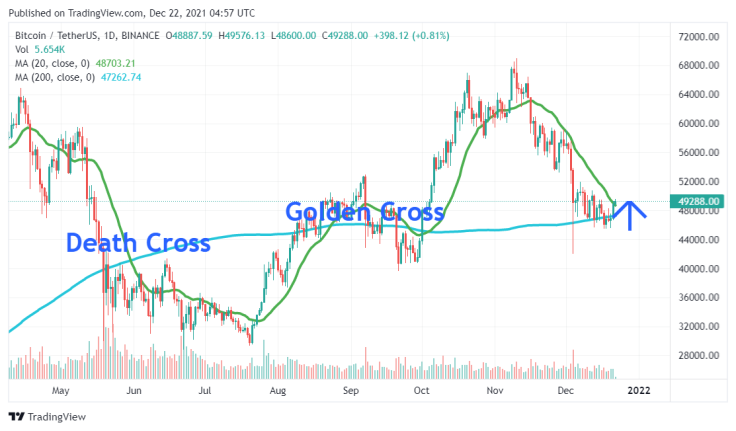
The arrow marked in the chart above shows that BTC avoided a death cross between the 20-day and 200-day Moving Averages this month. But if the bulls come in too late, we might see the completion of the pattern. However, nothing is absolute in the crypto market and traders must wait for a confirmation of the pattern.

© Copyright IBTimes 2026. All rights reserved.
- MOST READ