

Bitcoin Price Indicator Hints At 83% Drop: What Is The Death Cross?

KEY POINTS
- BTC may drop to $2,300 following the death cross
- Bitcoin's downtrend is far from over
- The death cross in 2018 preceded a year-long slide for BTC
The next barrier to Bitcoin's price is $8,800. Sunday's upward momentum to over $9,000, which pierced the 200-day moving average, wasn't sustained, and BTC slid to $8,549 as of this writing. To go beyond four digits, the best crypto by market cap must at least get over its immediate ceilings first.
However, an analysis put up by Yashu Gola of NewsBTC indicated that BTC is repeating a familiar technical pattern. The pattern that Gola is referring to is the death cross, and he recalled the occurrence of it after Bitcoin established its all-time high in 2017.
The death cross is when a short-term moving average crosses below a longer-term moving average. The common parameters are a 50-day MA for the short term and 100-day or 200-day MA for the longer term.
The first instance of the death cross that Gola identified happened around late March 2018. And although BTC was already descending from its apex before the cross took place, the price continued its downhill slope, flailing below the 200-day MA for a year.
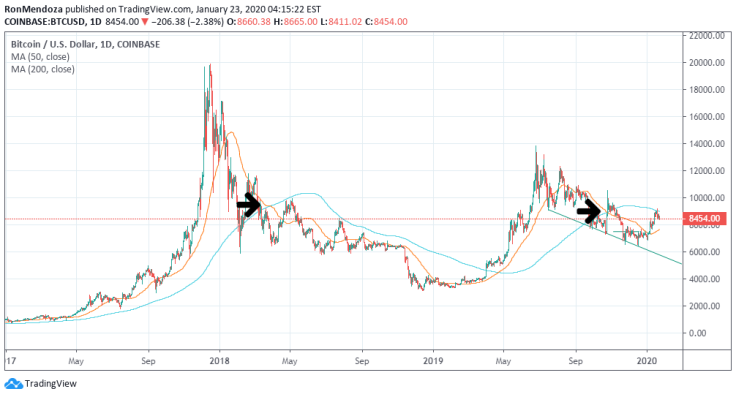
Gola also pointed out another instance of the same cross near the end of last year. After the surge to BTC's 2019 high, the price sunk with each succeeding month -- the only exception was August when its monthly lows were slightly higher than July. The death cross that was spotted in October was followed by further dips in November and December.
And even though price skyrocketed to $10,000 in October upon Chinese President Xi Jin Ping's positive remarks about blockchain, which placed the price above both moving averages, Gola still thinks that BTC's downtrend is "far from over." Gola estimates that price could drop 83 percent, targeting a $2,300 value.
In other markets like the S&P500, the death cross has also been observed many times. It showed up in the charts for at least five occasions in the decade long bull run. And, in most of those occurrences, the index traded higher subsequently.
Notably, the death cross on the S&P500's chart in August 2011 prefaced a rally that lasted four years or until the next death cross. Matt Maley, an equity strategist at Miller Tabak, commented about the chart pattern in 2018 saying that a 7 to 8 percent rally immediately followed the 2011 death cross.
© Copyright IBTimes 2025. All rights reserved.
- MOST POPULAR IN Business


