Why Is The US Consumer Feeling So Great Right Now?

American consumers had plenty of reasons to feel great about the economy in 2013 and every reason to continue that confidence into 2014, according to a pair of Gallup polls. Americans not only were more optimistic about the economy in 2013 but also contributed to it more than any year since the Great Recession began.
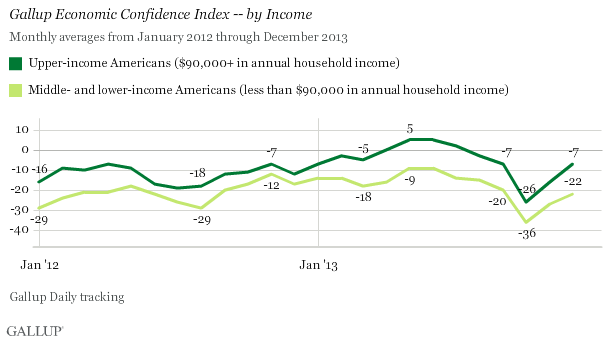
Gallup’s Economic Confidence Index shows that Americans were more confident about the economy in 2013 than at any point since 2008. This confidence reached a high of -7 (with 0 being an even split of positive and negative opinions) in May 2013, still more negative than positive but trending toward a more optimistic view. In October 2013, however, that optimism crashed down to -35 thanks to the federal government shutdown. Since the crisis was resolved, numbers have trended back upward, ending the year at -19.

Overall, wealthier Americans felt more confident about the economy in 2013, but middle- and lower-income Americans still saw their confidence increase. Both groups saw a decrease in confidence during the government shutdown, but overall opinions have sharply increased since October.
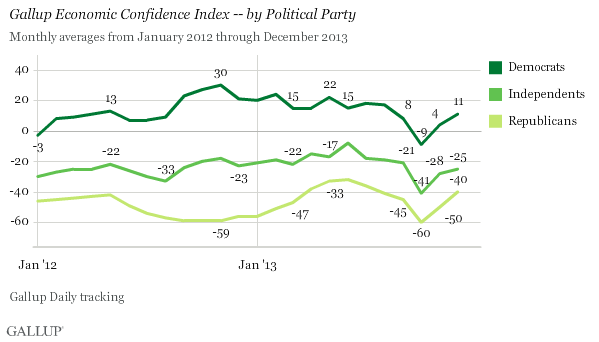
While Americans across the board are more optimistic about the economy, no group is more confident in the nation’s economic future than Democrats. In December, Democrats’ confidence in the economy rose 7 points, reaching +11. This leaves Democrats with the only positive index score across several subgroups including gender, age, income and region. Overall outlook increased across all subgroups in December, however.
Besides being more excited about the economy than they've been in years, American consumers are also participating in it more than any time since 2008. According to a separate Gallup poll, U.S. consumers spent an average of $96 per day in December, the highest daily average since September 2008, at the height of the recession. Gallup pollsters saw an increase in spending of $16 per day from the beginning of 2013 to December, with high points of $95 per day in August and $91 in November.
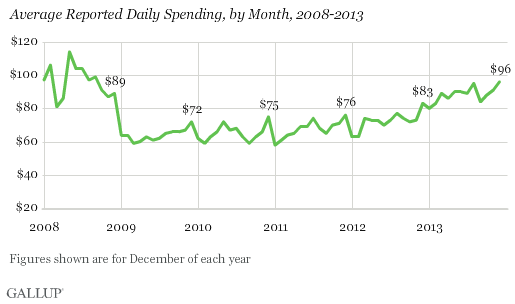
As Gallup notes, spending usually reaches its highest levels in December, as Americans rush to purchase Christmas presents for their friends and loved ones. Still, given similar highs in August and the gradual trend of increased spending throughout the year, it’s hard to write the December high off as a simple holiday fluke.
Daily spending is an important trend to watch when considering economic growth, and a continuing increase can signal future stability. Since Gallup began measuring daily spending in 2008, the highest measured average was $114 per day in May 2008, which quickly plummeted to a low of just $58 per day in January 2011. Since then, average daily spending has increased steadily, and if the trend continues, the United States could soon see a return to pre-recession spending levels.
© Copyright IBTimes 2026. All rights reserved.
- MOST POPULAR IN Business