

Bitcoin Price Could Shed 60% And Drop To $2,800, Monthly MACD Suggests
KEY POINTS
- Monthly MACD indicates that Bitcoin Price could shed 60% and drop to $2,800
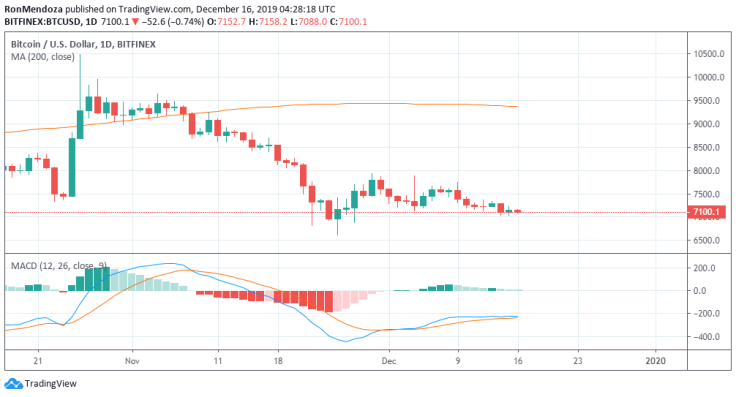
- Daily MACD paints the same bearish picture
- The last time a bearish cross happened on the MACD was July 2018 and BTC fell to $3,200
While many Bitcoin (BTC) bulls have high hopes for the flagship crypto next year due to the scheduled halving, the technicals, on the other hand, spell trouble. At least for the moment.
Bitcoin has been lingering between the $7,000 and under $8,000 range lately and even dropped near $6,600 on Nov. 25 -- a price level it hasn't seen since May this year. It has been trading under the 200-day moving average early last month, but one grander catalyst to a more bearish tone is the monthly MACD.
The Moving Average Convergence Divergence applied on a monthly chart signals an impending downturn for the leading crypto. When the MACD crosses above or below the signal, it indicates a possible shift in momentum (it's bullish if the MACD crosses above the signal line and bearish if it crosses below it).
As of the moment, the two lines are intersecting once more after being far apart for almost six months. The MACD signaled a bull move late, which was initially sparked by Bitcoin's runup to its 2019 high. Before that, the last time the two lines met was back in July 2018 when the MACD line crossed below the signal line that confirmed the bear market that took place at the start of the year -- that bearish cross preceded a move all the way down to $3,200.
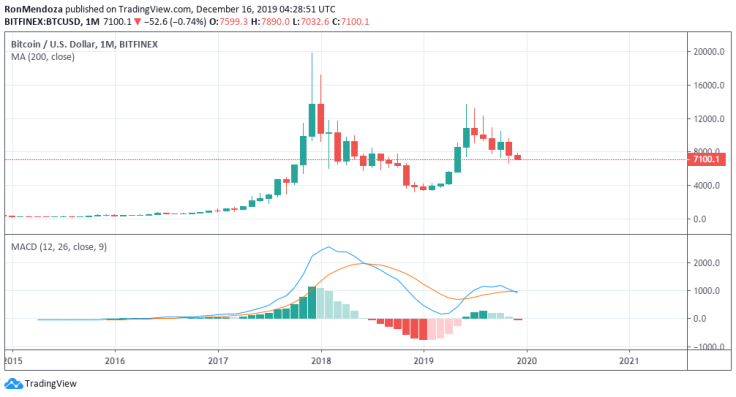
Cointelegraph notes that when that bearish cross happened last year, BTC lost 60% of its value. If that comes true at Bitcoin's current price of $7,100, that would be equivalent to a drop near $2,800. Imagine buying into the predictions of a Bitcoin bottom at $6,000, and the technicals prove to be correct and make a drop to $2,800. Buying 20 BTCs at $6,000 would mean that an investor would have to endure a hefty $64,000 loss before it gets better.
The daily MACD isn't looking too good either for the popular crypto as the same bearish picture appears. But for diehard BTC hopefuls, any further dip would be an opportunity to catch lower prices, especially if the "halvening" does prove to be an event that would exalt BTC's price.
© Copyright IBTimes 2025. All rights reserved.
- MOST POPULAR IN Business


