

Most Presidents Have Been Reelected When The Dow Is Above This Level On Election Day
KEY POINTS
- Dating back to George Washington, 87.5% of presidents have been re-elected when the U.S. stock market has had a net gain of more than 20% over the three-year period leading up to Election Day.
- Since March, the market has rebounded and so have President Trump’s chances to retain the White House.
- While it would take a substantial move down in the market for Biden to become a strong favorite, history suggests it wouldn’t take much for the race to become anybody’s game.
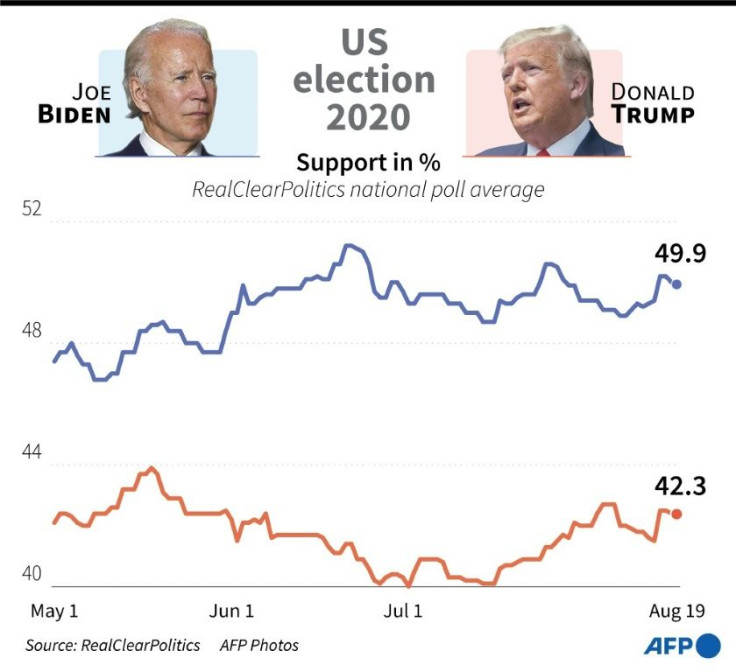
If you look at most polls, you would think Joe Biden has a 7-to-13 point lead in the 2020 presidential race. But one indicator with a 200-year track record begs to differ.
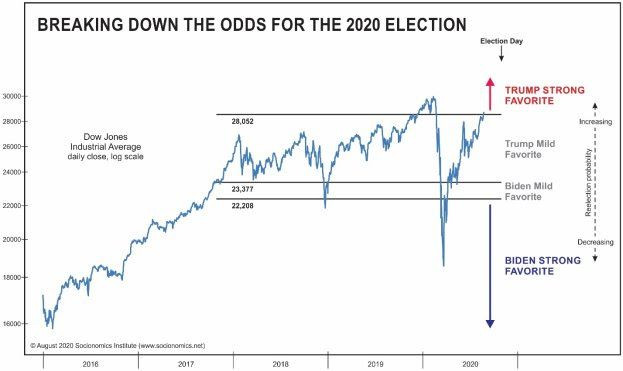
Dating back to George Washington, 87.5% of presidents have been re-elected when the U.S. stock market has had a net gain of more than 20% over the three-year period leading up to Election Day. With the Dow Jones Industrial Average 22.5% above its key three-year level, the odds currently stand squarely in the president’s favor.
Let’s break down the numbers. Three years before Election Day 2020, the Dow was at 23,377 -- 20% above that level is 28,052. The Dow closed on Aug. 28 at 28,653. If the Dow is still trading above 28,052 when Americans cast their votes, history suggests President Trump would be a strong favorite to win.
Over the past 228 years, only two presidents have lost their re-election bids with a three-year net gain in the stock market of more than 20%. The other 14 presidents who sought another term under such market conditions won.
The three-year window is useful because presidents serve four-year terms, and the president’s predecessor often gets the credit or blame for conditions during the first year.
This research extends a 2012 study from our team at the Socionomics Institute in which we examined every presidential re-election bid in history and found that the stock market has been a better re-election indicator than GDP, inflation and unemployment combined. We think that’s because the stock market reflects social mood more swiftly than macroeconomic indicators do.
Lest we be accused of partisan hackery, back in 2012 we used our framework to anticipate a win for Barack Obama based on the boom in the stock market during his first term. And in March of this year, we wrote that the odds back then favored a defeat for Trump in the wake of the stock market’s precipitous slide. Since March, the market has rebounded and so have President Trump’s chances to retain the White House.
How low would the stock market have to go for the odds to swing strongly back on Biden’s side? It would take a big drop like we had earlier in the year. Only one incumbent has been re-elected when the stock market was more than 5% below its key three-year level, which corresponds to action below 22,208 in the Dow for this election.
While it would take a substantial move down in the market for Biden to become a strong favorite, history suggests it wouldn’t take much for the race to become anybody’s game. Incumbents have fared only a little better than a coin flip when the stock market has net gained between 0% and 20% over the three-year period before Election Day. Just a few percentage points lower in the Dow, and Biden would be back in contention.
Our chart depicts these scenarios along with the corresponding levels to watch in the Dow. A lot can happen between now and Nov. 3, so we’ll continue to keep an eye on the stock market for clues about how the odds in the race are shifting along the away.
Matt Lampert is the director of research at the Socionomics Institute, a think tank that studies the relationship between social mood, financial markets and social trends. He is a contributing author to the book Socionomic Causality in Politics , an Amazon #1 bestseller in behavioral psychology.
© Copyright IBTimes 2025. All rights reserved.
- MOST POPULAR IN Business


