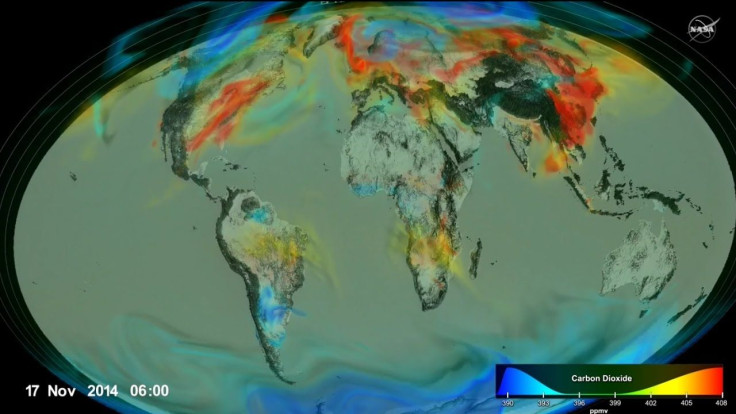
NASA Reveals First 3D Visualization of Earth's Carbon Dioxide Levels

NASA released a 3D view of carbon dioxide levels across the globe in a video on Wednesday.
The Orbiting Carbon Observatory satellite, OCO-2, collected data of carbon dioxide levels around the world from Sept. 1, 2014 through Aug. 31, 2015. The satellite launched in 2014 and is the first designed by NASA to measure the atmosphere’s CO2 at regional scales.
That data, along with a high-resolution weather model, reveals how carbon dioxide moves across the world. The new supercomputer project is a step towards understanding CO2 and the planet’s future, NASA says.
CO2, which is released from human activities like burning fossil fuels, plays a major role in trapping heat in Earth’s atmosphere. The concentration of the gas moves and changes through seasons.
Through the OCO-2 satellite, scientists developed a model of the behavior of carbon in the atmosphere from the timeframe the data was collected.
"Since September of 2014, OCO-2 has been returning almost 100,000 carbon dioxide estimates over the globe each day," said OCO-2 science team leader David Crisp. "Modeling tools like those being developed by our colleagues in the Global Modeling and Assimilation Office are critical for analyzing and interpreting this high resolution dataset."
The space agency says scientists can use models like the one developed to better understand and predict where CO2 concentrations could be especially high or low based on ground activity.
Scientists also needs to understand the processes driving the "carbon flux," which is the exchange of CO2 among the atmosphere, land and ocean.
"We can't measure the flux directly at high resolution across the entire globe," said Lesley Otta member of the OCO-2 science team. "We are trying to build the tools needed to provide an accurate picture of what's happening in the atmosphere and translating that to an accurate picture of what's going on with the flux. There's still a long way to go, but this is a really important and necessary step in that chain of discoveries about carbon dioxide."
NASA says the 3D visualization shows detailed information about global CO2 fields that has not been seen before, like the “rise and fall of carbon dioxide in the Northern Hemisphere throughout a year; the influence of continents, mountain ranges and ocean currents on weather patterns and therefore carbon dioxide movement; the regional influence of highly active photosynthesis in places like the Corn Belt in the U.S.”
© Copyright IBTimes 2025. All rights reserved.


