

Bitcoin Price Analysis: Bears May Be About To Tighten Their Grip As Bitcoin Fails Support At $53K
KEY POINTS
- Bitcoin has fallen below its important support level of $53K
- Popular analyst Lark Davis suggests that Omicron Covid virus variant is shaking up the market
- Nearly $285M of BTC longs liquidated in about 30 minutes
Bitcoin has come under the embrace of the bears and the price of the most recognizable cryptocurrency has been dropping rapidly, dipping below $53,000, which was seen by many analysts as an important support line. The king of cryptocurrencies, which hit a new all-time high in November, was, however, unable to break through the $60,000 barrier and has slid since.
The price of BTC at 10:53 p.m. ET stood at $52,404, data from CoinMarketCap showed. Investors are, naturally, worried but a look at the many technical factors at play show the current bearishness has some deep roots.
An unwritten rule of the crypto market is that when Bitcoin falls, all other major altcoins join it on the way down. Bitcoin fell nearly 7.16% in the last 24 hours. The daily candle for Friday opened at $56,484, and reached a daily high of $57,600. But then the king was unable breach this level, and rapidly slid to $51,600.
Bitcoin price analysis shows bears calling the shots
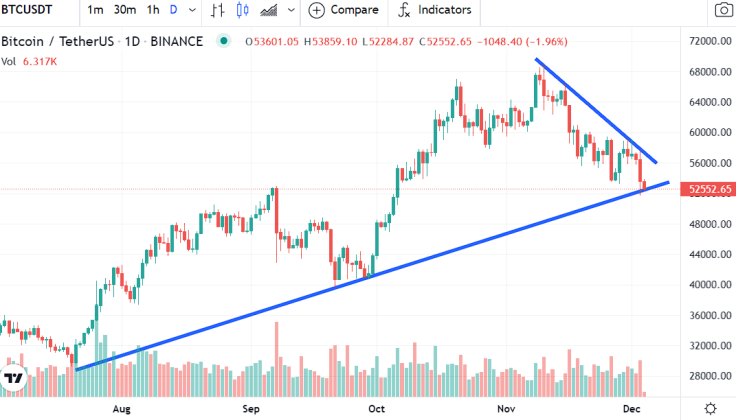
The BTC/USDT daily chart above shows that Bitcoin is currently testing an important support line. This trend line has been acting as a support for the price fractal since the July-August time frame. Bitcoin falling below this price level does not bode well, because the chances of an uptrend become rather slim at that point. Many analysts have also noted the importance of this support trend line.
But then, traders bought the tip as the wick of the candle showed (in the chart above) that Bitcoin's price did move up, closing the daily candle for Friday at $53,601, after touching a daily low of $51,680.
Popular analysts weigh in
An interesting aspect of the crypto market is the huge sway held by popular analysts via their social media posts over investors, especially the Gen Z and Millennials. Those analysts were quick to tweet out the fact that an important floor line had been breached. Benjamin Cowen, a popular crypto analyst and the CEO of Into The Cryptoverse, hoped that Bitcoin would hold above the support trend line. But it did not.
On Friday, as prices fell below this trend line briefly, Lark Davis, another popular analyst and crypto enthusiast with more than 700,000 followers on Twitter, commented on the same.
#bitcoin losing a major line of support, no bueno pic.twitter.com/YOLKcqXFqR
— Lark Davis (@TheCryptoLark) December 3, 2021
"Volatility is the price you pay for performance," Davis said in another tweet.
The bears are marching in
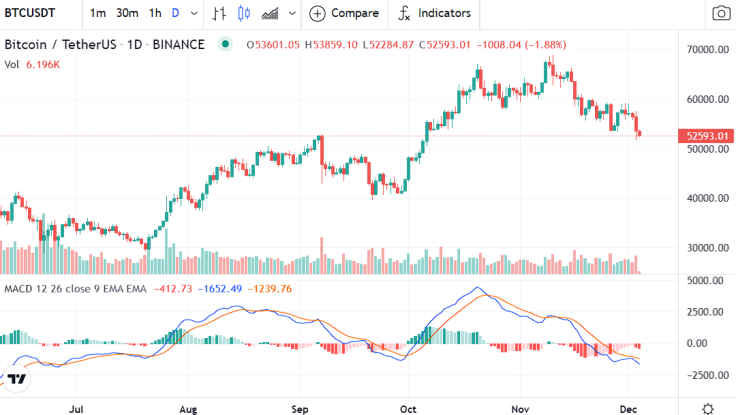
The BTC/USDT daily chart on the Binance exchange above shows that the MACD (Moving Average Convergence Divergence) line (blue) failed to cross above the signal line (orange), failing to achieve a bullish divergence on the daily chart. This caused the bearish divergence (signal line crossing above the MACD line) witnessed in mid-November to be extended. The MACD histogram captures this bearishness with a number of red bars.
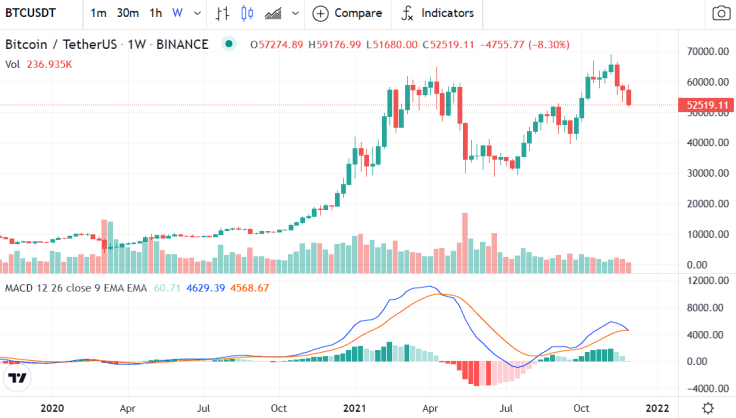
The BTC/USDT trading pair on the weekly chart above too seems to indicate that the bears may be about to strengthen their grip. The weekly MACD histogram has been bullish following August, filled with green bars after the bullish divergence that was witnessed. But the MACD line is now touching the signal line, and it seems that a bearish divergence on the weekly chart is imminent. If the blue line does cross below the orange line on the weekly chart, the bears will consume the market, and a similar scenario to what happened in May might be repeated. At that time Bitcoin rose to a high at $64,800 and then fell below $29,000 in June.
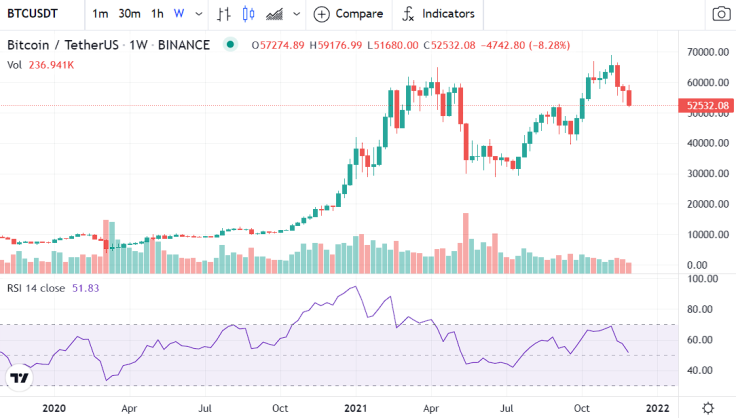
The chances of a fall in Bitcoin's price are high as the conditions for bearish divergence on the weekly chart are nearly complete. The RSI (relative strength index) levels on the daily chart are a clear indication of the same: the line is dropping from the bullish region, and the gradient is negative. This negative gradient suggests that Bitcoin prices will drop further.
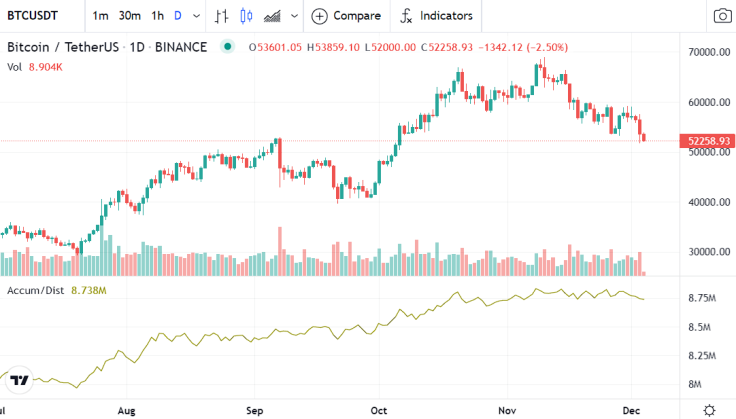
And here is another indication that the bears are not going away soon. The above chart shows the rise in the accumulation of Bitcoin. The Accumulation/Distribution line indicates that Bitcoin is being bought and held in the long run — the accumulation of BTC has reached historical levels since July — but then the devil is in the gradient of the line for the short term: it seems rather negative. In simpler terms, some of whales may be selling BTC, adding to the pressure on its price.
The argument is supported by the below chart, which shows BTC price vs Bitcoin whales with more than 1000 BTC in their wallets. The number of whales was the highest was in Feb but has come down — indicating a continuing bearish sentiment.

There are additional reasons for the bearishness that Bitcoin is seeing. Will Clemente, the host of Blockware Intelligence Podcast, told his more than 400,000 followers that "nearly $285M of BTC longs" were "liquidated in 30 mins" when Bitcoin fell below 53k.
And then there is the most obvious reason: rising fears about the spread of the Omicron variant of the coronavirus and the accompanying economic uncertainty. "We are rather far away from breaking this downtrend and we could still see more downside too with the Covid fears shaking markets," Davis said in another tweet.
We are rather far away from breaking this downtrend and we could still see more downside too with the COVID fears shaking markets. #bitcoin
— Lark Davis (@TheCryptoLark) December 4, 2021
International Business Times holds no liability for any investments made based on the information provided on this page. We strongly recommend independent research and/or consultation with a qualified professional before making any investment decisions.
Parth Dubey holds Bitcoin (BTC), Ethereum (ETH), Solana (SOL), Cardano (ADA) and Polygon (MATIC).

© Copyright IBTimes 2025. All rights reserved.
- MOST POPULAR IN BTC


